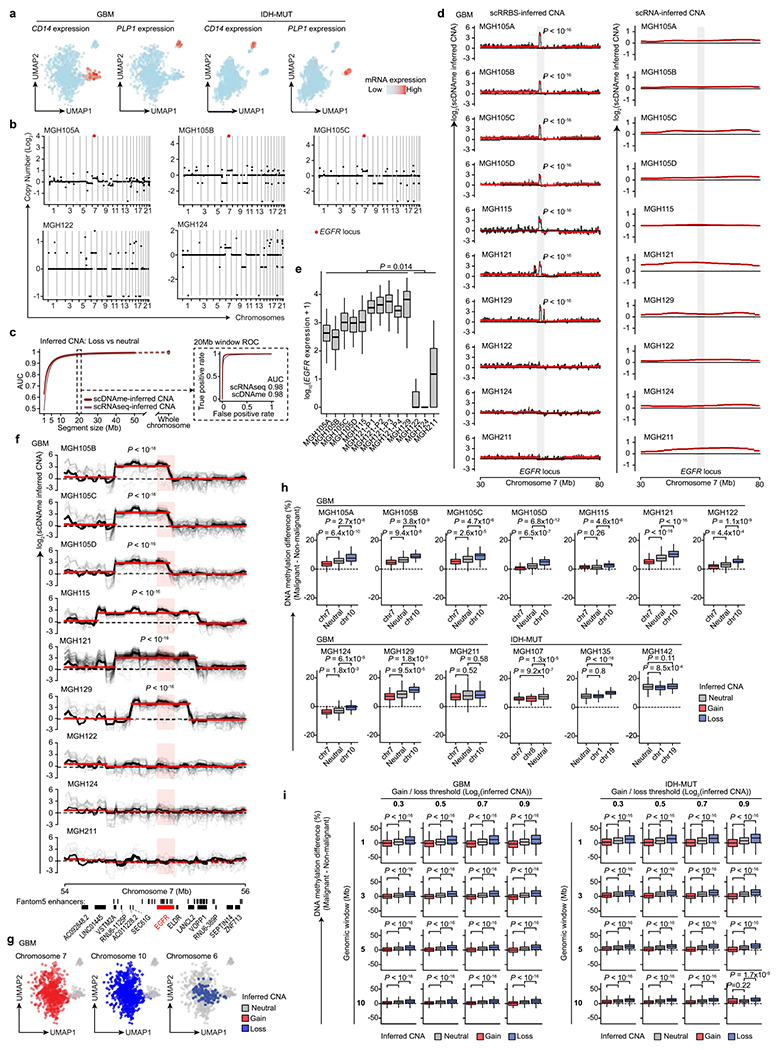
Extended Data Fig. 3 |. High-resolution copy number alteration mapping enabled by single-cell multi-omics.

a, UMAP of single cells that passed quality control based on scRNAseq (GBM n = 937, IDH-MUT n = 809). b, CNA inference based on bulk WES for GBM samples MGH105A/B/C, MGH122, and MGH124. EGFR locus is highlighted. c, CNA inference by scDNAme (red line) and scRNAseq (grey line) performance in correctly classifying chr. loss vs. neutral, as assessed by the AUC of ROC curve at different genomic window resolutions. ROC curve at 20 Mb resolution is shown (inset). 95% confidence intervals were generated using bootstrapping. d, CNA inferred by scDNAme (left) and scRNAseq (right) at a 50 Mb region centered at EGFR locus. Mean CNA profile per sample is shown in black. Red lines represent CNA segments identified by circular binary segmentation (CBS) analysis. e, EGFR expression as assessed by scRNAseq for each GBM patient sample (n = 844 malignant-only cells that passed quality control based on scRNAseq). f, Same as (d) for CNA inference by scDNAme at a 2 Mb region centered at EGFR locus. Individual cell CNA profiles are shown in grey. g, UMAP of single cells as defined in (a). Clonal chr. 7 gain (left) and chr. 10 loss (middle), as inferred by scDNAme, along with sub-clonal loss of chr. 6 (right), are indicated. h, Percentage of CpG methylation change at copy number gain, loss, and neutral chromosomal regions when comparing DNAme level of individual malignant cells to baseline for GBM (n = 7) and IDH-MUT (n = 3) samples. i, Same as (h) across all GBM and IDH-MUT samples for different thresholds adopted to define copy number gain vs. loss genomic window resolutions. P values were determined by two-sided Mann-Whitney U-test (d-f, h-i), comparing the EGFR expression median values across samples (e). Boxplots represent the median, bottom and upper quartiles, whiskers correspond to 1.5 times the interquartile range.
