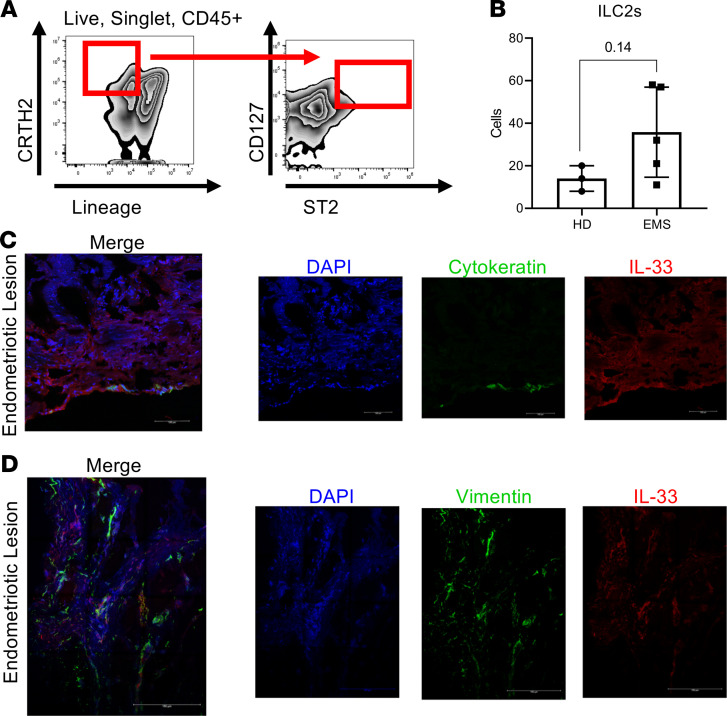
Figure 1. ILC2 abundance and IL-33 expression in samples from patients with endometriosis.
(A) Representative flow cytometric analysis of group 2 innate lymphoid cells (ILC2s) in peritoneal fluid of healthy donors (HD) and patients with endometriosis (EMS). (B) The number of ILC2s in EMS (n = 5) and HD (n = 3). The P value (P = 0.14) for this comparison is shown. (C and D) Representative images of immunofluorescence staining demonstrating colocalization of IL-33 to epithelial cells (cytokeratin+) and to stromal cells (vimentin+), respectfully, in the endometriotic lesion microenvironment (n = 3). Scale bars: 100 μm (first image, C and D); 150 μm (second, third, and fourth image, C and D). Mean ± SD. Nonparametric Student’s t test with Mann-Whitney.

