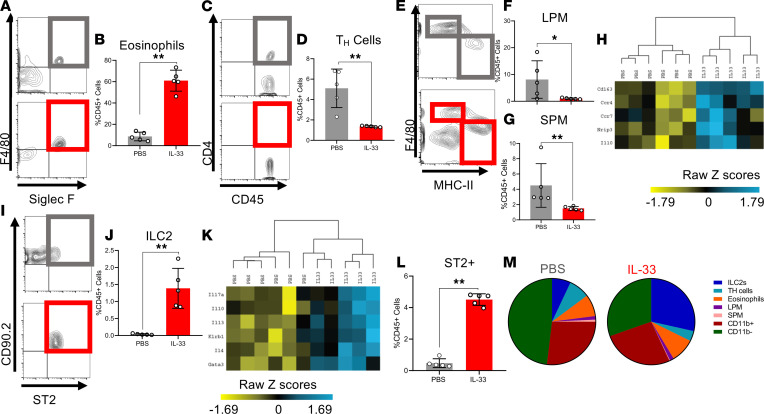
Figure 3. IL-33 alters the localized, peritoneal immune profile in EMS murine model.
(A, C, E, and I) Representative flow cytometric images and gating strategy for immune profiling conducted on PF samples, including eosinophils, Th cells, LPM, SPM, and ILC2s in PBS-treated (n = 5) and IL-33–treated (n = 5) WT mice. (A and B) Frequency of eosinophils (singlet, live, CD45+CD11b+F4/80+, Siglec-F+). (C and D) Frequency of Th cells (singlet, live, CD45+CD11b–, F4/80–, CD4+). (E and F) Frequency of LPM (singlet, live, CD45+CD11b+Siglec-F–F4/80hi, MHC-IIlo). (E and G) Frequency of SPM (singlet, live, CD45+CD11b+Siglec-F–F4/80lo, MHC-IIhi). (H) Unsupervised hierarchical clustering using Euclidean distance and complete linkage of M2 alternative activation–associated genes expressed in RNA isolated from lesions of PBS- and IL-33–treated mice (Nanostring nSolver). (I and J) Frequency of ILC2 (singlet, live, CD45+ lineage–CD25+Thy2+, ST2+). (K) Unsupervised hierarchical clustering using Euclidean distance and complete linkage of ILC2-associated genes expressed in total RNA isolated from lesions of PBS- and IL-33–treated mice. (L) Proportion of ST2+ cells in the PBS- and IL-33–treated mice. (M) Pie graphs depicting the range of PF cells that are ST2+ in the PBS- and IL-33–treated mice. *P< 0.05, **P < 0.01. Mean ± SD. Nonparametric Student’s t test with Mann-Whitney.

