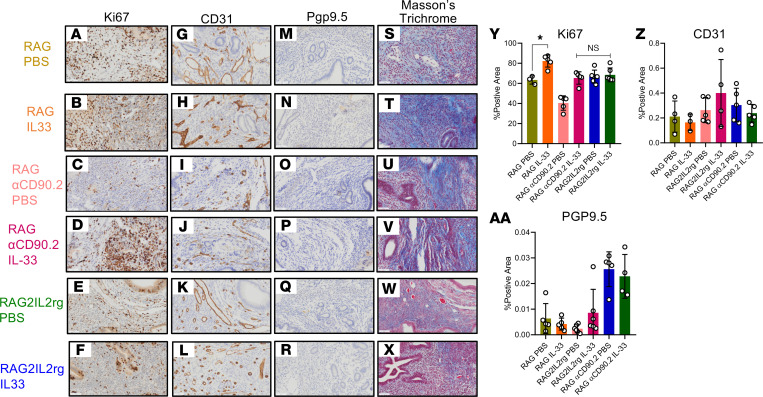
Figure 7. IL-33–driven lesion proliferation and fibrosis is ILC2 dependent.
RAG2–/– mice (ILC2 intact), RAG2–/–αCD90.2 mice (ILC2 depleted), and RAG2–/–IL-2rγ–/– mice (ILC2 deficient) were induced with endometriosis and underwent alternate day i.p. injections of PBS (n = 3-6) or IL-33 (n = 4-6). (A–F) Representative immunohistochemical staining and quantitative analysis of lesion Ki67 staining. (G–L). Representative immunohistochemical staining and quantitative analysis of lesion CD31 staining. (M–R). Representative immunohistochemical staining and analysis of lesion Pgp9.5 staining. (S–X) Representative immunohistochemical staining and analysis of lesion Masson’s trichrome staining. Original magnification, ×200. Scale bar: 50 μm. (Y) Analysis of the percentage of Ki67+ area. (Z) Analysis of the percentage of CD31+ area. (AA) Analysis of the percentage of Pgp9.5+ area. *P < 0.05. Mean ± SD. One-way ANOVA was used.

