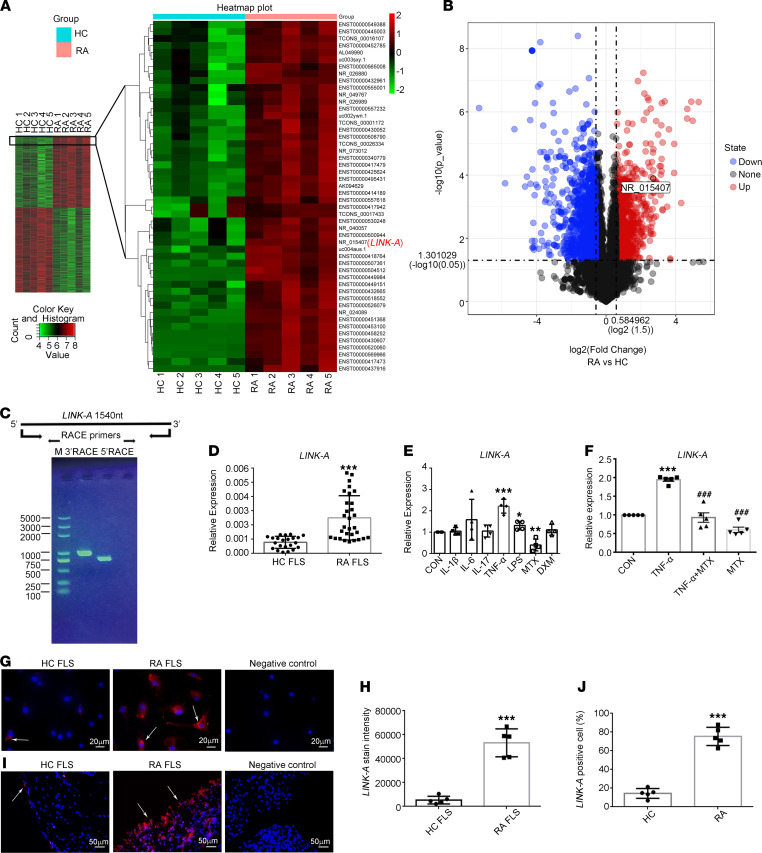
Figure 1. Increased levels of lncRNA LINK-A in FLSs and synovial tissues from patients with RA.
(A) Total RNA harvested from RA FLSs (n = 5) and HC FLSs (n = 5) was screened by microarray analysis. Microarray heatmap of distinguishable expression profiles of lncRNAs. (B) Volcano plot shows differentially expressed lncRNAs between RA FLSs and HC FLSs. P < 0.05, by Student’s t test. (C) RACE assay of LINK-A. The image shows amplification products of 5′ and 3′ ends of LINK-A. M, marker. (D) Verification of LINK-A by RT-qPCR in HC FLSs and RA FLSs. Ct values were normalized to GAPDH. Data are presented as the mean ± SD. (E) Expression of LINK-A in RA FLSs treated with IL-1β (10 ng/mL), TNF-α (10 ng/mL), IL-6 (10 ng/mL), IL-17 (10 ng/mL), LPS (10 ng/mL), methotrexate (MTX, 10 μg), and dexamethasone (DXM, 1 μg) for 24 hours. (F) Effect of MTX (10 μg) on TNF-α–induced LINK-A expression. (G and H) Cellular localization of LINK-A was measured by RNA FISH assay. Shown are representative images of LINK-A (red) and nuclei (blue) from 5 different RA patients and HCs. Graph (H) shows the quantification of staining intensity for 5 different RA patients and HCs. Original magnification, ×400. (I and J) LINK-A expression, evaluated by ISH staining, in synovial tissues from HCs and RA patients. Shown are representative images (I) and quantification of the percentage of LINK-A–positive cells (J) from 5 different RA patients and HCs. A scrambled probe was used as a negative control. White arrows indicate LINK-A–positive (red) cells. Original magnification, ×630. *P < 0.05, **P < 0.01, ***P < 0.001 versus HC FLSs or control (CON); ###P < 0.001 versus TNF-α, by Student’s 2-tailed t test or 1-way ANOVA (for E and F).

