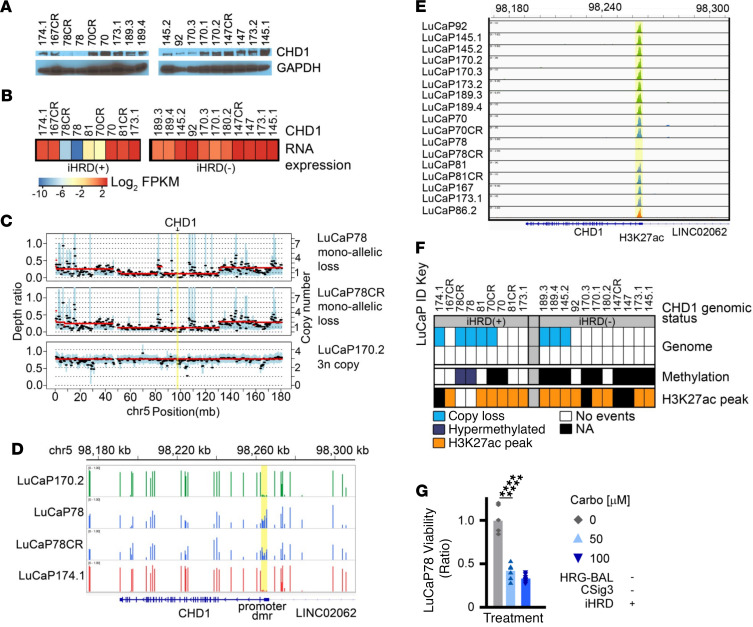
Figure 5. A de novo model of CHD1 loss demonstrates functional HRR deficiency.
(A) Western blot showing CHD1 protein expression across 20 LuCaP PC PDX lines. (B) Heatmap showing median centered CHD1 mRNA expression across 20 LuCaP PDX lines determined by RNA-Seq. The heatmap scale represents log2-scaled normalized CHD1 expression. (C) Copy number profile of CHD1 in 3 representative LuCaP PDX lines determined by whole-exome sequencing. LuCaP78 and LuCaP78CR exhibit monoallelic copy number loss of CHD1. (D) CHD1 genomic methylation status determined by EPIC methylation arrays. Shown are the IGV tracks indicating promoter hypermethylation at the upstream promoter of CHD1 in LuCaP78 and LuCaP78CR PDX lines. A comparison of normalized beta values across probes for 12 CPG loci in the putative CHD1 promoter region was done using a 2-sided independent-sample t test (P = 2.17 × 10⁻¹⁰). (E) IGV track showing the H3K27 acetylation (H3K27ac) mark at the CHD1 5′ promoter locus demonstrating loss of the H3K27ac peak in the upstream promoter of LuCaP78 and LuCaP78CR PDX lines. (F) Heatmap showing CHD1 genomic status across 20 LuCaP PDX lines. LuCaP78 and LuCaP78 CR have CHD1 monoallelic copy loss paired with CHD1 promoter hypermethylation and loss of H3K27ac peak. (G) Cell viability assessments of LuCaP78 PDX lines grown in vitro and measured 72 hours after treatment with vehicle or 50 μM or 100 μM carboplatin. Measurement represents the mean ± SD of 8 replicate experiments. Comparison of cell viability was performed using 2-sided paired t tests. (P value: **** < 0.0001). See uncut gels in Supplemental Figure 7 and in online supplemental material.

