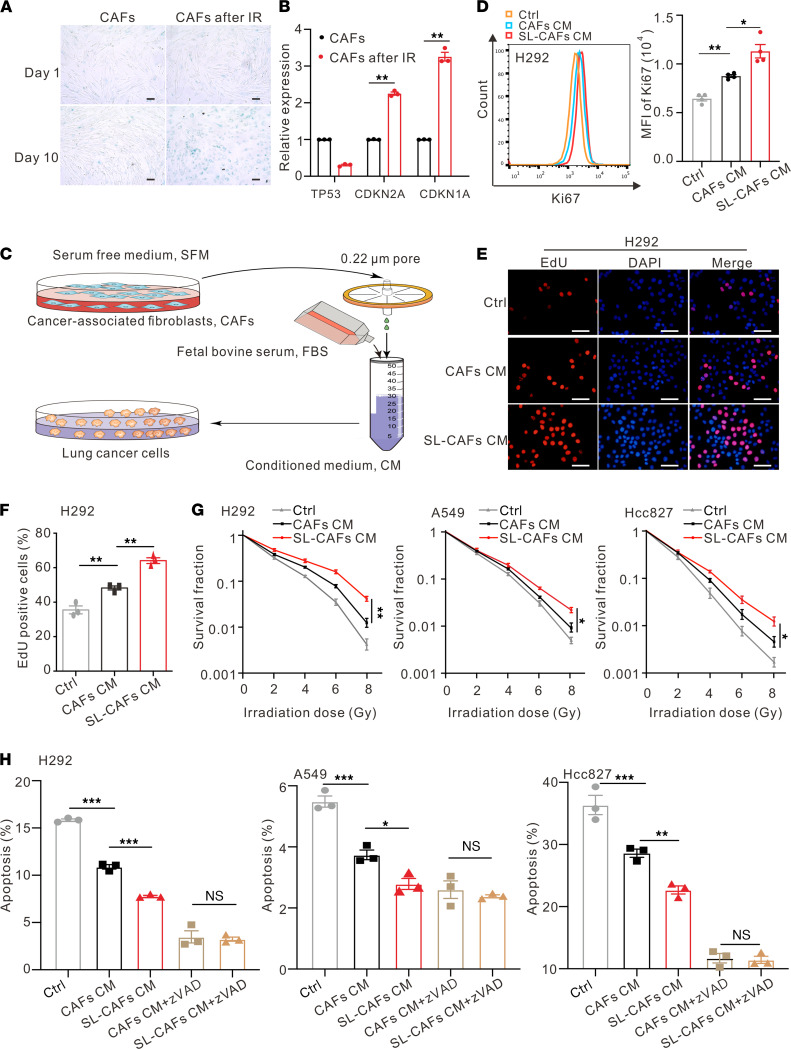
Figure 1. Effects of SL-CAFs on NSCLC cells in vitro.
(A) Cell senescence detected by SA–β-Gal staining assay. Scale bar: 100 μm. (B) Relative mRNA expression of senescence-associated genes in CAFs 10 days after IR. The indicated results represent the mean ± SEM of 4 independent experiments, analyzed by Student’s t test. (C) Schematic diagram of the CM preparation process. (D) Left panel, Ki67 expression of H292 cells cultured with normal medium, CAF CM, or SL-CAF CM for 48 hours detected by flow cytometry. Right panel, statistical analysis of Ki67 expression. The indicated results represent the mean ± SEM of 3 independent experiments, analyzed by 1-way ANOVA. (E) Representative images of EdU staining of H292 cells cultured with CAF CM, SL-CAF CM, or control medium for 48 hours. Scale bar: 100 μm. (F) Quantification of EdU-positive H292 cells in indicated groups detected by flow cytometry. The indicated results represent the mean ± SEM of 3 independent experiments, analyzed by 1-way ANOVA. (G) Clonogenic survival curves of NSCLC cells pretreated with CAF CM, SL-CAF CM, or control medium for 48 hours and then irradiated with 2, 4, 6 or 8 Gy. Cell survival fractions were normalized to those of the unirradiated control cells. The indicated results represent the mean ± SEM of 3 independent experiments, analyzed by 2-way ANOVA. (H) NSCLC cells pretreated with CAF CM, SL-CAF CM, or control medium for 48 hours and then irradiated with 8 Gy. The apoptosis rates were measured 72 hours after 8 Gy IR detected by flow cytometry, as indicated in different groups. The indicated results represent the mean ± SEM of 3 independent experiments, analyzed by 1-way ANOVA. *P < 0.05; **P < 0.01; ***P < 0.001; n.s., not statistically significant. SL-CAFs, senescence-like CAFs; zVAD, Z-VAD-FMK.

