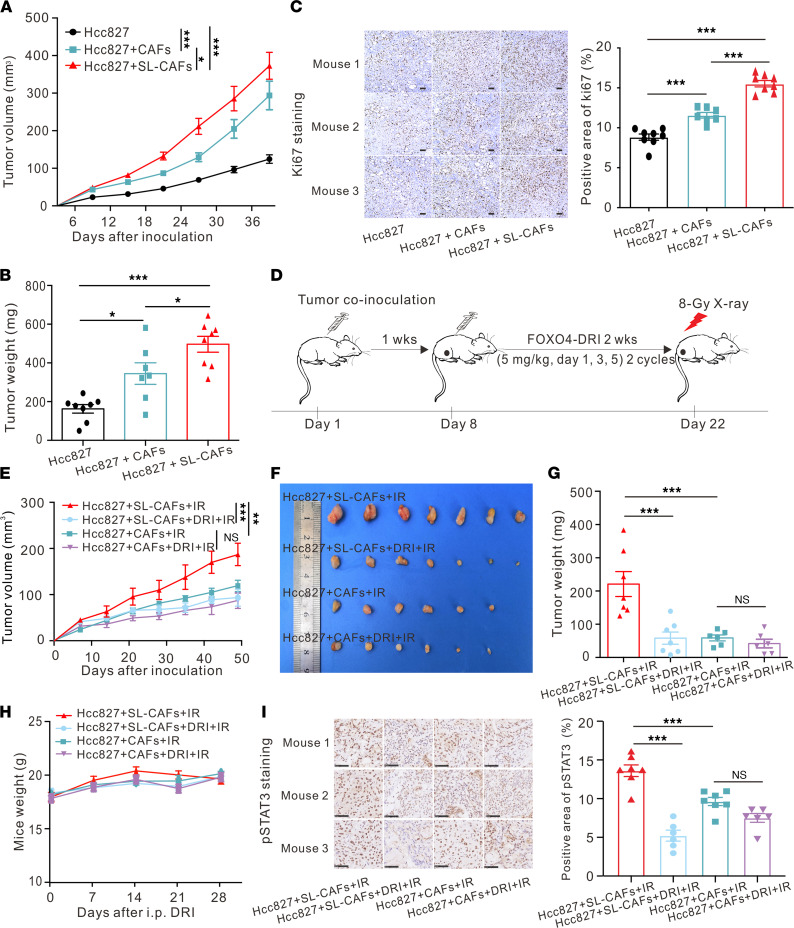
Figure 4. Effect of FOXO4-DRI in improving radiosensitivity in vivo.
(A) Tumor growth curves for mice s.c. coinjected with Hcc827 cells with SL-CAFs or CAFs. Hcc827 cells injected alone as control. Mean ± SEM (n = 7–8 mice per group), analyzed by 2-way ANOVA. (B) Tumor weight for mice s.c. coinjected with Hcc827 cells with SL-CAFs or CAFs. Hcc827 cells injected alone as control. Mean ± SEM (n = 7–8 mice per group), analyzed by 1-way ANOVA. (C) Representative images of the Ki67 immunohistochemistry staining in dissected tumors (Scale bar: 100 μm), and semi-quantitative analysis of positive area of Ki67 immunohistochemistry staining by ImageJ software (NIH). Mean ± SEM (original magnification, 400×; 3 microscopic fields per mouse to evaluate the averaged ki67+ area, n = 7–8 mice per group), analyzed by 1-way ANOVA. (D) Schematic of experiment to assess FOXO4-DRI–improved radiosensitivity In mouse model. (E) Tumor growth curves for mice in different groups as indicated. Mean ± SEM (n = 6–7 mice per group), analyzed by 2-way ANOVA. (F) Photo of dissected tumors and (G) quantification of tumor weights in each group. Mean ± SEM (n = 6–7 mice per group), analyzed by 1-way ANOVA. (H) Mouse weights measured at indicated time points. (I) Representative images of the pSTAT3 immunohistochemistry staining in dissected tumors of different groups (Scale bar: 50 μm), and semi-quantitative analysis of positive area of pSTAT3 immunohistochemistry staining by ImageJ software. Mean ± SEM (Original magnification, 400×; 3 microscopic fields per mouse to evaluate the averaged pSTAT3 area; n = 6–7 mice per group), analyzed by 1-way ANOVA. *P < 0.05; ***P < 0.001; n.s., not statistically significant. SL-CAFs, senescence-like CAFs.

