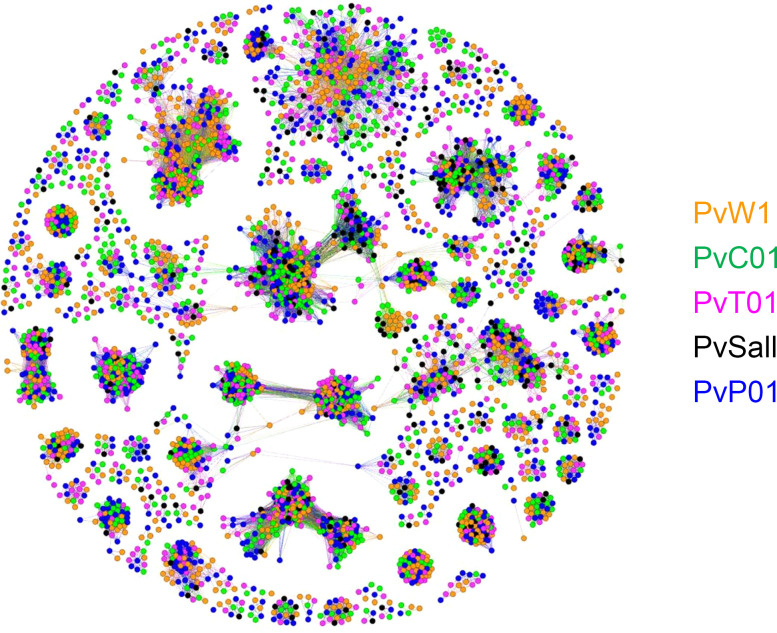
Figure 6. Cluster analysis of the PvW1 VIR proteins.
Cluster analysis of the 1145 predicted VIR proteins encoded by the PvW1 genome compared with those of other P. vivax isolates (30, 31). Each spot represents a VIR protein from either PvW1 (orange), PvC01 (green), PvT01 (pink), PvSalI (black), and PvP01 (blue). Relatedness between the proteins is represented by distance; therefore, more closely related proteins cluster together. Most of the clusters contain proteins from several isolates, suggesting that the clusters are not restricted to specific genomes or geographical distribution.

