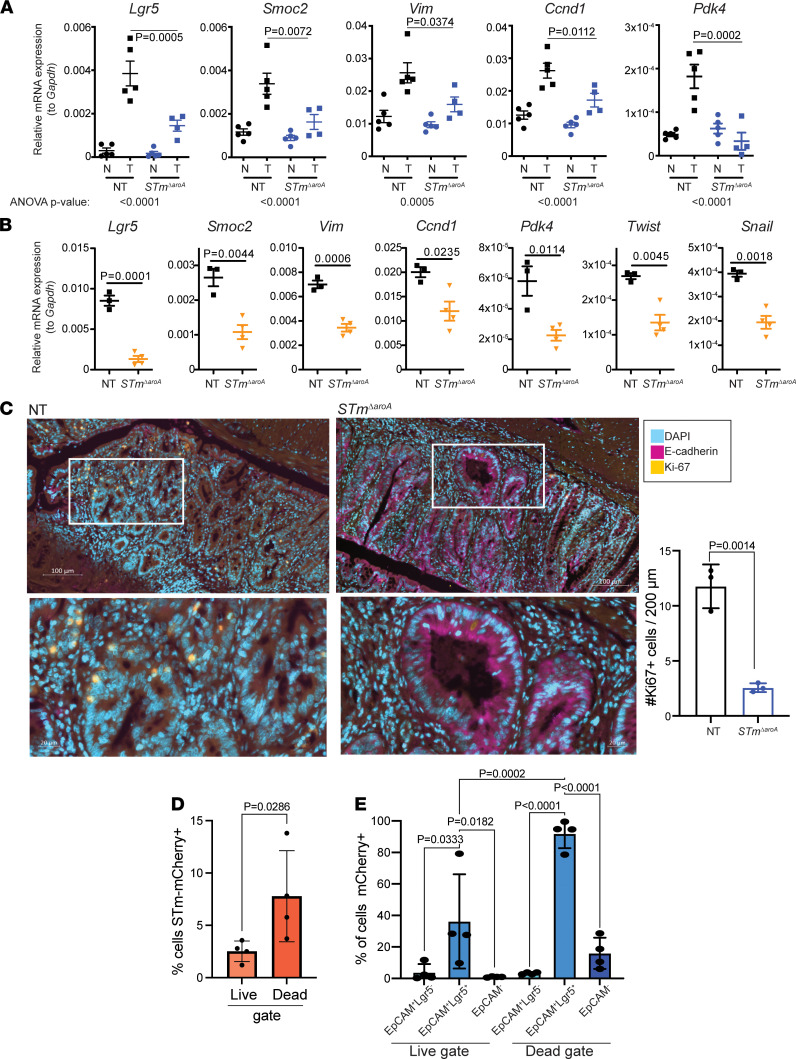
Figure 4. Altered tumor phenotype in STmΔaroA-treated mice.
(A) Quantitative PCR confirmation of genes identified (or pathway related) by RNA-Seq in CAC tumor–bearing mice after 6 weeks of treatment. Nontreated, NT; Salmonella treated, STmΔaroA; normal tissue, N; tumor tissue, T. Size of tumors used to isolate RNA are shown in Supplemental Figure 7. Data are representative of 3 independent experiments. One-way ANOVA with Turkey’s multiple-comparison test was conducted. ANOVA P values are indicated below the graphs, and an individual post hoc test comparing T from each treatment is shown on the graphs. (B) Analysis of indicated transcripts in Apcmin/+ tumor tissue after 10 weeks of treatment. Data come from 3 (NT) or 4 (STm) mice shown in Figure 1E. Similarly sized polyps were obtained from each group. Data are representative of 2 independent experiments. Unpaired 2-tailed t tests were used. (C) Representative immunofluorescence of E-cadherin (purple) and Ki67 (yellow) counterstained with DAPI (blue) in NT and STmΔaroA-treated (6 weeks) CAC mice. Scale bar: 100 μm. Lower images are magnification of upper images. Scale bar: 20 μm. For orientation reference, Supplemental Figure 5 shows the type of area (not taken from exact mouse/tumor) imaged here. Quantification of the number of Ki67+ cells within 200 μm field of view (FOV) shown to the right. Ten FOV from 2–3 tumors per mouse. Each dot represents the average number for each mouse. (D) Lgr5-GFP reporter mice were induced with CAC, as per Figure 1A. Mice were then gavaged with mCherry-expressing STmΔaroA, and tumors were collected for flow cytometry analysis 24 hours later. Cells were stained for live/dead marker and EpCAM (CD326); Lgr5-GFP and mCherry were expressed via reporters. Two-tailed Student’s t test. (E) From D, cells were first gated based on EpCAM and Lgr5 expression (as indicated) and the percentage of mCherry+ in each population is shown. One-way ANOVA with multiple-comparison post hoc test. Each point represents pooled tumors from 1 mouse. All data are shown as mean ± SD.

