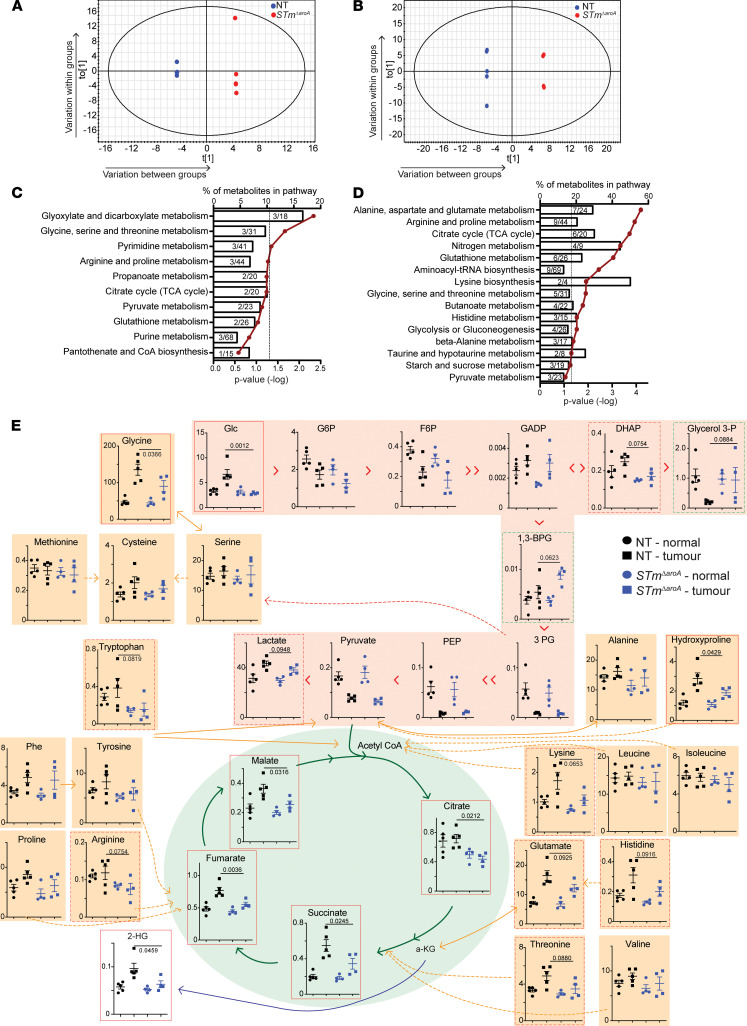
Figure 5. STmΔaroA treatment alters the metabolic environment of CAC tumors.
Tumor metabolites of CAC-induced colon tumors were assessed by GC-MS. (A and B) OPLS analysis of metabolites comparing nontreated (NT) and STmΔaroA-treated tumors after 6 weeks (A) and 24 hours (B) of treatment. The size of tumors used for analysis is shown in Supplemental Figure 7, B and C. All metabolites significantly different between STmΔaroA-treated and nontreated tumors (VIP score > 1) were submitted to pathway analysis (MetaboAnalyst). (C and D) Pathway analysis for 6 weeks of STmΔaroA treatment (C) and 24 hours treatment (D), represented as the percentage of metabolites in a pathway that were altered, against P value (–log); hypergeometric test used. (E) Metabolites detected from glycolysis (pink shading) and TCA cycle (green shading), and amino acids (orange shading), with interrelationships depicted (24 hours after treatment). The x axis shows nmol/g. One-way ANOVA was performed with Bonferroni multiple-comparison test; P values shown are the multiple-comparison statistic. Data are shown as mean ± SD. Both 6-week and 24-hour analyses were performed on 2 independent experiments, with similar changes observed in both sets.

