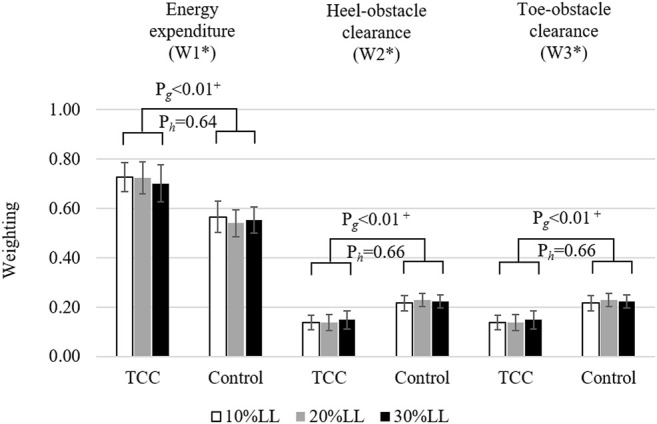
FIGURE 4.

Means (standard deviations) of the best-compromise weighting sets (W1*, W2*, W3*), corresponding to the objective functions of mechanical energy expenditure, heel-obstacle clearance, and toe-obstacle clearance of the MOOC problem, for the TCC and Control groups when crossing obstacles of three different heights: 10% (white), 20% (grey) and 30% (black) of individual subject’s leg length (LL). P-values for the main effects are also given (Pg: group effects; Ph: height effects). +: statistically significant differences between groups (p < 0.05).
