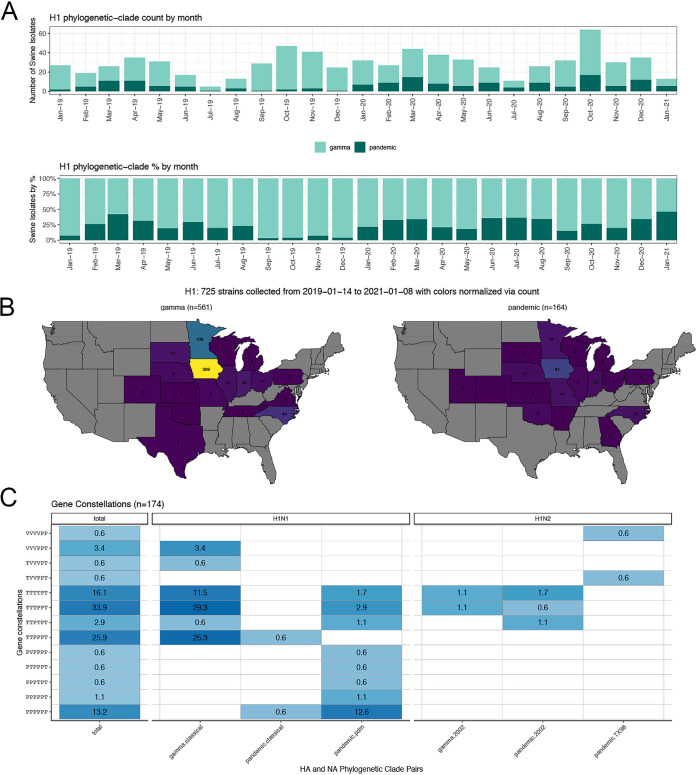
FIG 1.
Example use case of octoFLUshow at https://flu-crew.org/, where a user can select a date range and IAV clades of interest to track their associated detection distribution across time, location, and whole-genome patterns. (A) Detection frequency of two H1 HA clades (1A.3.3.2/pandemic in dark green and 1A.3.3.3/gamma in light green) from January 2019 to January 2021; (B) spatial distribution of each H1 HA clade with the raw count plotted within each U.S. state and colored according to the detection frequency of the HA clade plotted (in this figure, the scale range is 1 to 309); and (C) relative proportions of whole-genome patterns for the selected H1 HA clades, with darker shades of blue indicating higher proportions, the x axis reflecting the HA-NA pairing, and the y axis representing the genome constellation in the order of polymerase basic gene 2, polymerase basic gene 1, polymerase acidic gene, nucleoprotein gene, matrix gene, and nonstructural gene (PB2-PB1-PA-NP-M-NS) and reflecting combinations of either live attenuated influenza virus vaccine lineage (V), the triple reassortant (T) lineage, or lineage H1N1pdm09 (P). Maps were created using R and ggplot2.

