
FIGURE 2.
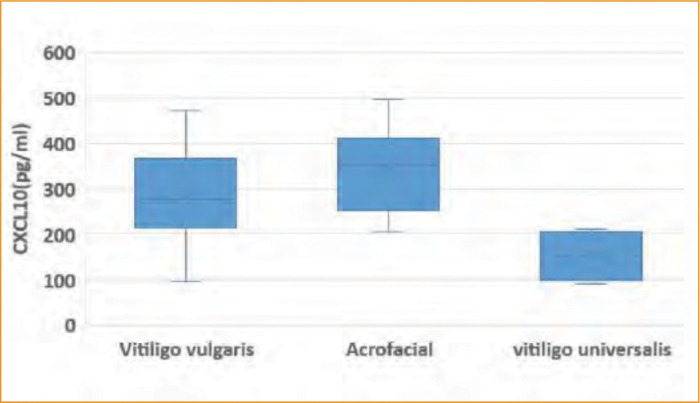
Boxplot representing chemokines CXCL10 in relation to the extent of disease among the studied vitiligo patients (n=40).
Official websites use .gov
A
.gov website belongs to an official
government organization in the United States.
Secure .gov websites use HTTPS
A lock (
) or https:// means you've safely
connected to the .gov website. Share sensitive
information only on official, secure websites.
Boxplot representing chemokines CXCL10 in relation to the extent of disease among the studied vitiligo patients (n=40).