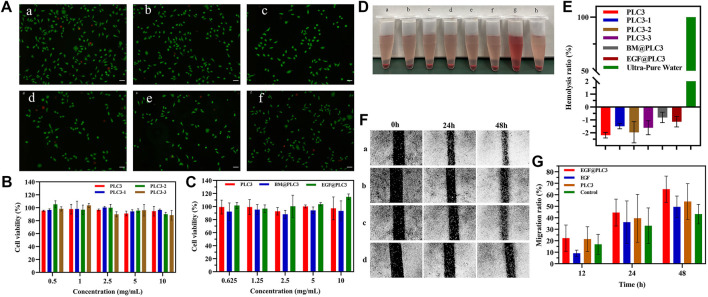
FIGURE 5.
In vitro biocompatibility and cell-proliferation tests. (A) Live/Dead staining of a) EGF@PLC3, b) BM@PLC3, c) PLC3, d) EGF, e) BM, and f) control; scale bar: 100 μm. (B) CCK-8 for blank hydrogels. (C) CCK-8 for hydrogels loaded with drugs. (D) Hemolysis test on a) PLC3, b) PLC3-1, c) PLC3-2, d) PLC3-3, e) BM@PLC3, f) EGF@PLC3, g) Ultra-pure water, and h) saline. (E) The quantitative result of hemolysis test. (F) Cell scratch test on a) EGF@PLC3, b) EGF, c) PLC3, and d) control groups. (G) Measuring analysis on cell scratch test. With the data shown as means ± SD (n = 3).

