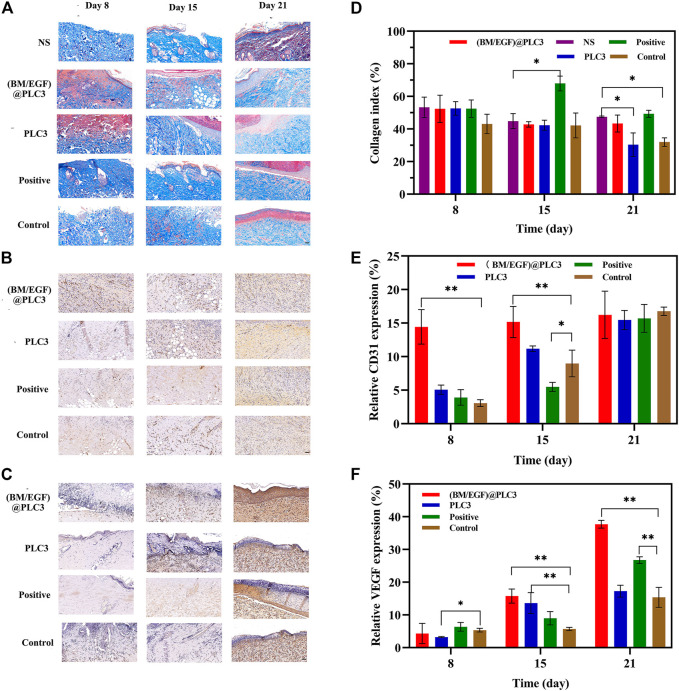
FIGURE 8.
The result of quantitative detection. (A) Masson’s trichrome staining, (B) CD31 Staining, and (C) VEGF staining of sampled tissue on days 8, 15, and 21 before treatment. Quantitative detection for (D) collagen, (E) CD31, and (F) VEGF of sampled tissue. With the data shown as means ± SD (n = 3, *p < 0.05, **p < 0.01), scale bar: 50 µm.

