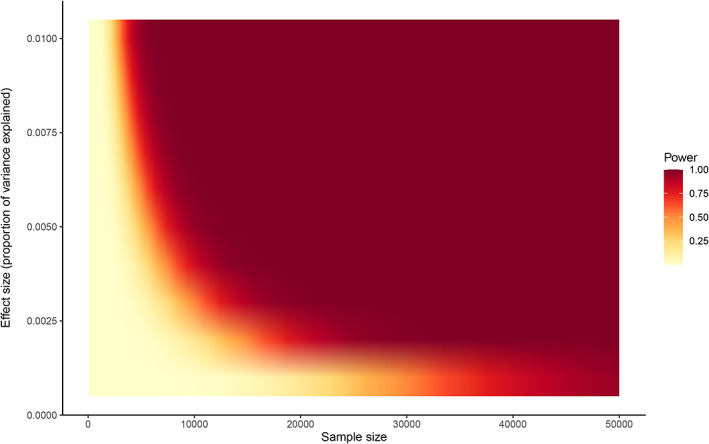
FIGURE 1.

Power to detect a genome‐wide significant locus (at ∝ = 5 × 10⁻⁸) for variants explaining 0.1 to 1.0% of the variance in a quantitative trait, for sample sizes of 100 to 50,000 individuals. These analyses assume that the data come from unrelated individuals, and that additional covariates in the GWAS are not associated with the variant. See https://github.com/kaustubhad/gwas‐power for R code and a tutorial on calculating power analyses for GWAS; see also Smith and Nichols (2018), who discuss power in the context of testing multiple traits
