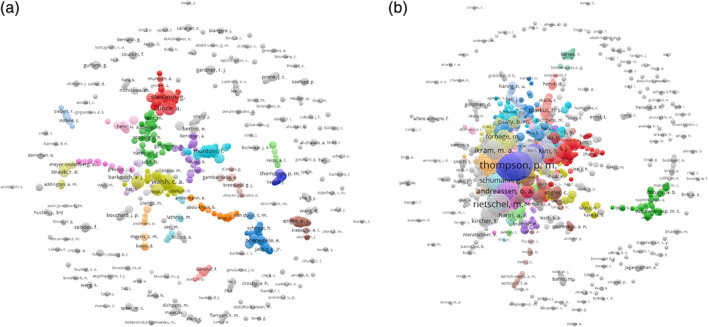
FIGURE 5.

Coauthorship network diagrams for imaging genetics publications indexed in PubMed: (a) from 2000 to 2010, and (b) from 2010 to 2020. Network analyses were conducted using VOS viewer (van Eck & Waltman, 2010) using the default clustering methods, normalized by association strength, using a repulsion strength of 0 in the layout. Data extracted August 14, 2020, using the following search syntax (a) (((("2000/01/01"[Date‐ Publication]: "2010/01/01" [Date ‐ Publication])) AND (((linkage) OR GWAS) AND imaging genetics)) AND MRI) AND English[Language] (b) (((("2010/01/01"[Date ‐ Publication]: "2021/01/01" [Date ‐Publication])) AND ((linkage) OR GWAS) AND imaging genetics)) AND MRI) AND English[Language]
