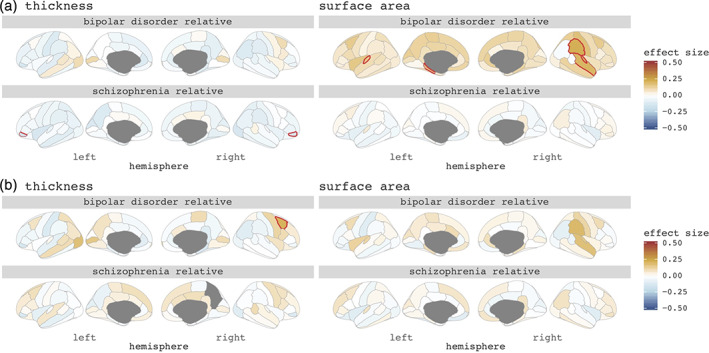
FIGURE 1.

Cohen's d effect sizes comparing bipolar relatives and schizophrenia relatives to controls on (a) regional cortical thickness (left) and cortical surface area (right), (b) corrected for mean cortical thickness (left) and total surface area (right). Red lined regions survive false discovery rate correction for multiple testing (q < 0.05)
