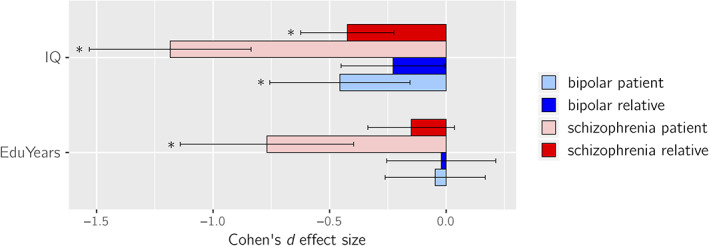
FIGURE 2.

Cohen's d effect sizes comparing bipolar disorder patients (light blue), bipolar disorder relatives (blue), schizophrenia patients (pink), and schizophrenia relatives (red) to controls for intelligence quotient scores (IQ; top) and educational attainment (EduYears; bottom). The error bars depict the lower and upper 95% confidence intervals (CIs). *p < .001
