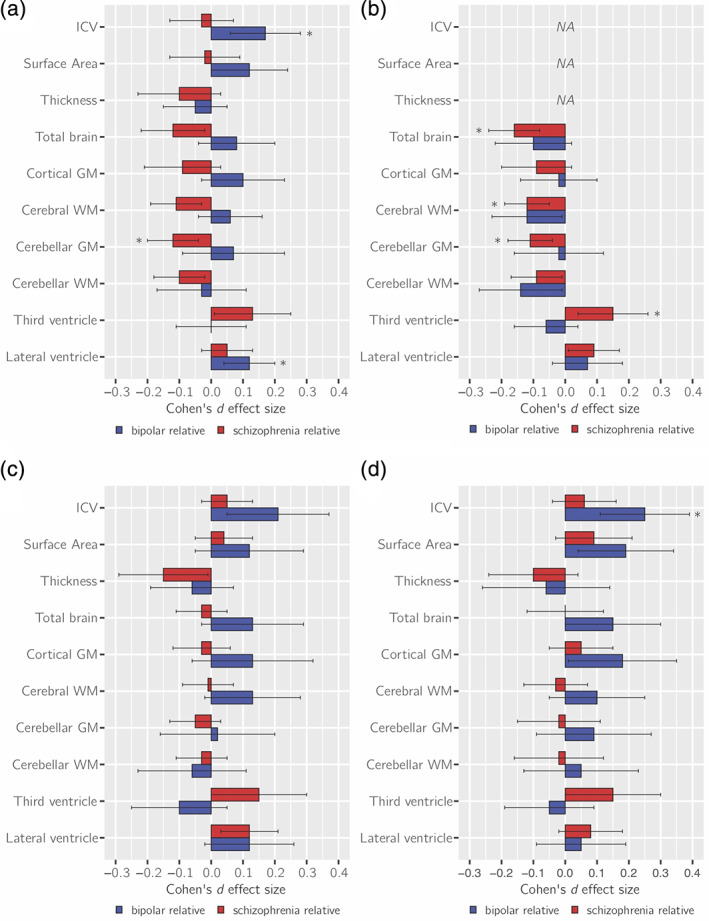
FIGURE 3.

Cohen's d effect sizes comparing schizophrenia relatives (red), and bipolar disorder relatives (blue) to controls on (a) global brain measures, corrected for (b) intracranial volume (ICV), (c) intelligent quotient (IQ), (d) educational attainment. Analyses displayed in (a) and (b) have been presented in our previous study, but are repeated here, for completeness, albeit with slightly different cohorts (de Zwarte, Brouwer, Agartz, et al., 2019). Error bars depict the lower and upper 95% confidence intervals (CIs). *q < 0.05, corrected. GM, gray matter; NA, not corrected for ICV; WM, white matter
