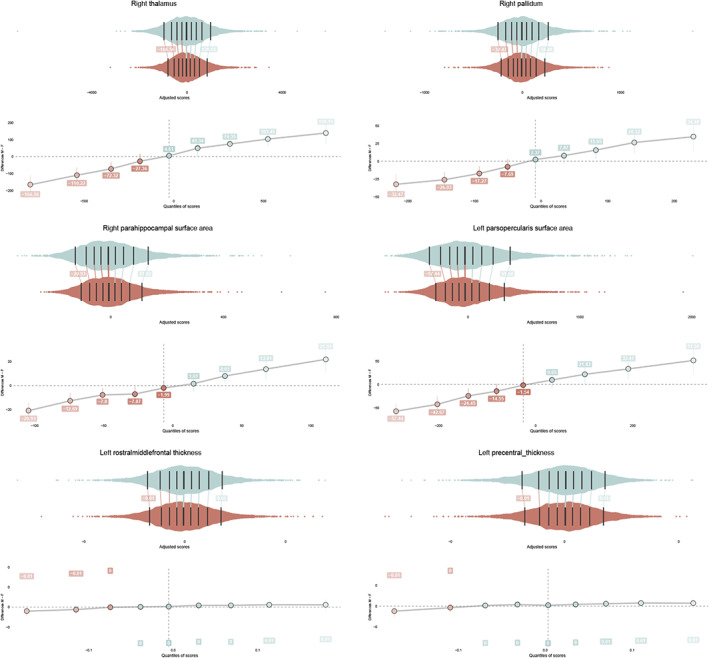
FIGURE 3.

Jittered marginal distribution scatterplots are displayed together with their shift function for the top three variance ratio effects of subcortical volumes (top), cortical surface area (middle) and cortical thickness (right). The central, darkest line on each distribution is the median, note that main sex effects are removed. The other lines mark the deciles of each distribution. The shift values are included, which refer to the number of units that the male (upper) distribution would have to be shifted to match the female (lower) distribution. Confidence intervals are included for each of these shift values
