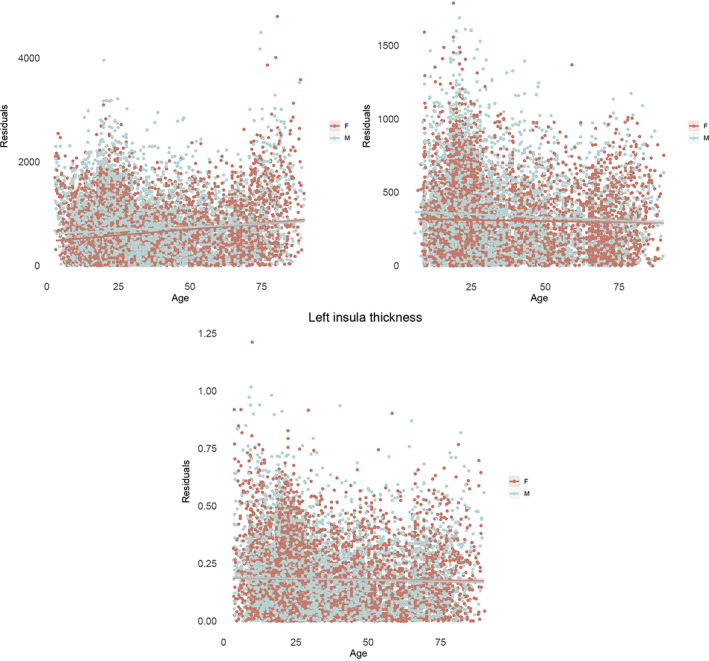
FIGURE 5.

Sex differences in variability interacted with age in 50% of the subcortical volumes, 30% of the surface area measures, and only one thickness measure. Three representative results are shown: right thalamus volume (top left), surface area of the right parahippocampal gyrus (top right) and thickness of the left insula (bottom center). Absolute residual values are modeled across the age range. Effects showed larger male than female variance in the younger age group, this effect attenuated with increasing age
