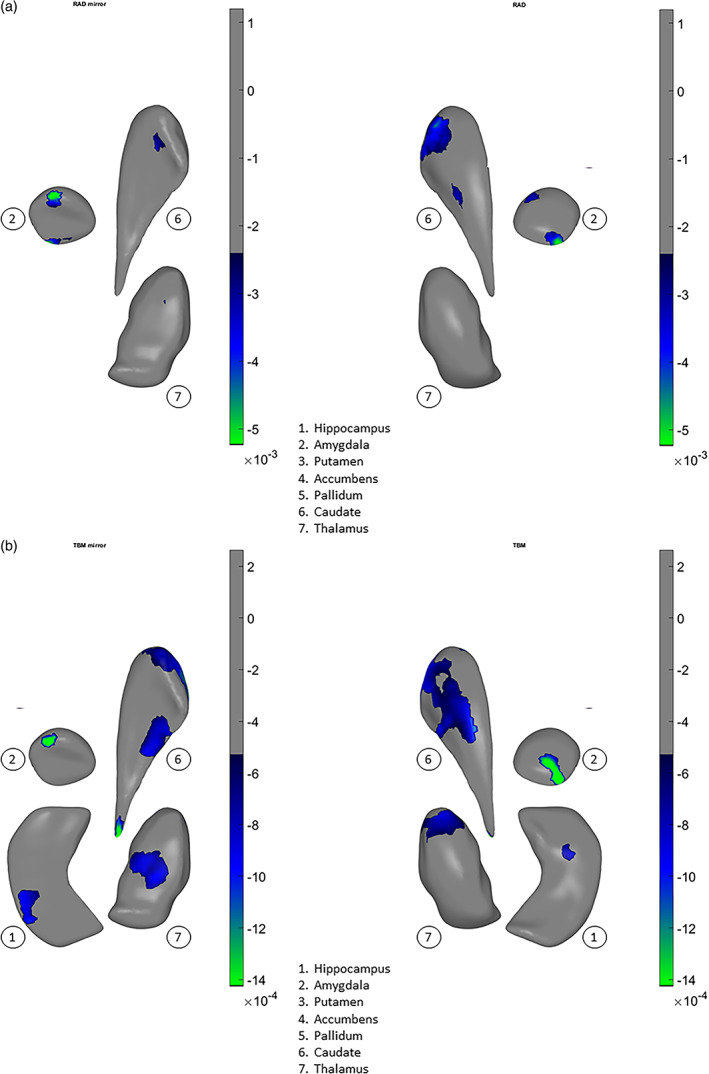
FIGURE 5.

Overall and vertex‐wise effects of SAPS total scores across both hemispheres for (a) thickness, (b) surface dilation/contraction (log Jacobian determinant). The effects are tested in models that included diagnosis sex, age, age x sex, age2, age2 x sex, and ICV. Small but statistically significant relationships are found between higher SAPS total scores and locally reduced thickness in the amygdala, caudate, and thalamus (a), and surface contraction (b) in the hippocampus, amygdala, caudate, and thalamus. In the left column, the subcortical structures—1. hippocampus (panel b, surface contraction only), 2. amygdala, 6. caudate, and 7. thalamus—are positioned generally from a bottom viewpoint, with some slightly rotated about their own principal axis to be oblique, for better exposure: caudate—pi/7 or about 25°, accumbens—pi/10 or 18°. In the right column, the subcortical structures are positioned generally from a top viewpoint with the same rotations. Color scale indicates the intensity of effect sizes. Cooler colors indicate negative associations, that is, higher chlorpromazine dose equivalents are associated with reduced surface measures. Gray color indicates nonsignificant surface vertices after multiple comparison correction. Accumbens, putamen, and pallidum are not shown as no effects were found for these subcortical structures
