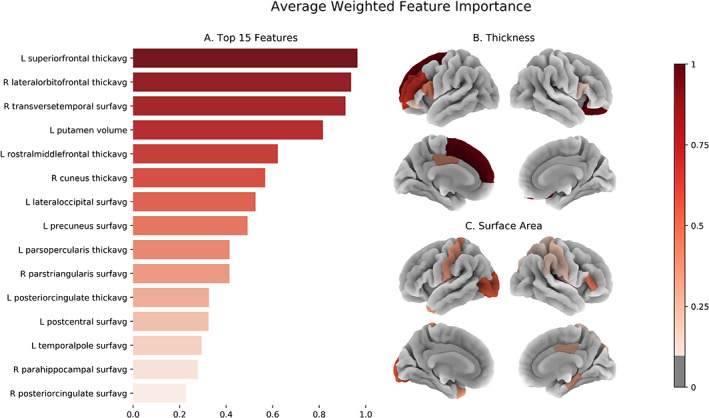
FIGURE 4.

(a) The top 15 features (threshold chosen for readability), as ranked by average weighted feature importance (where 0 indicates a feature appeared in none of the GA final models, and 1 represents a feature appeared in all) are shown. (b) The cortical thickness and (c) cortical average surface area feature importance scores, above an a priori selected threshold of 0.1, are shown as projected onto the fsaverage surface space
