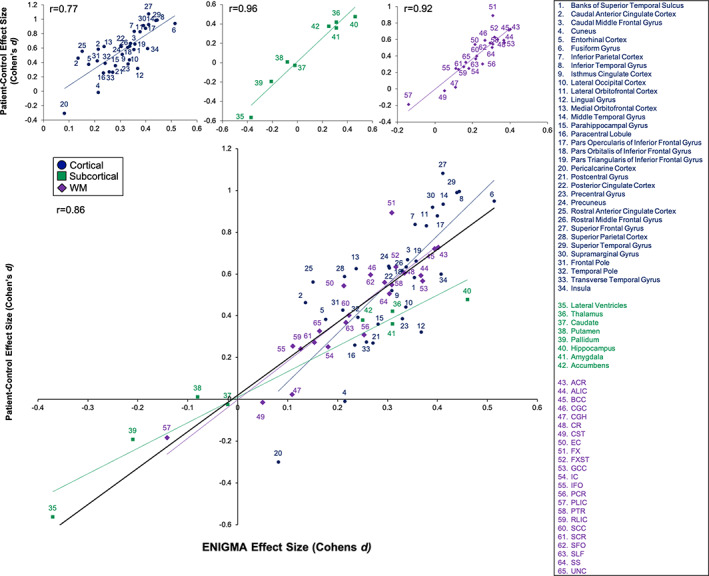
FIGURE 1.

Scatterplot of the cortical, subcortical, and white matter effect sizes (Cohen's d coefficients, y‐axis) derived using the full patient‐control comparison in this sample versus the Enhancing Neuro Imaging Genetics Meta‐Analysis (ENIGMA) effect sizes (x‐axis) in the corresponding imaging modalities
