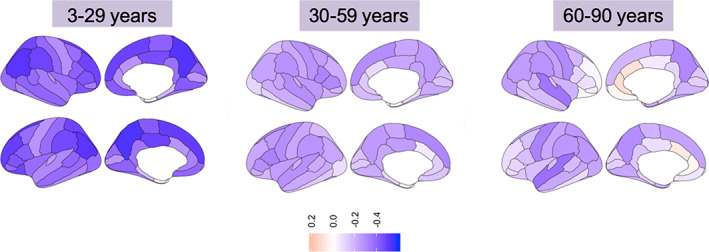
FIGURE 3.

Correlation between age and cortical thickness across age‐groups. Left panel: early life age‐group (3–29 years); Middle panel: middle life age‐group (30–59 years); Right panel: late life age‐group (60–90 years). Blue hues = negative correlations; Red hues = positive correlations
