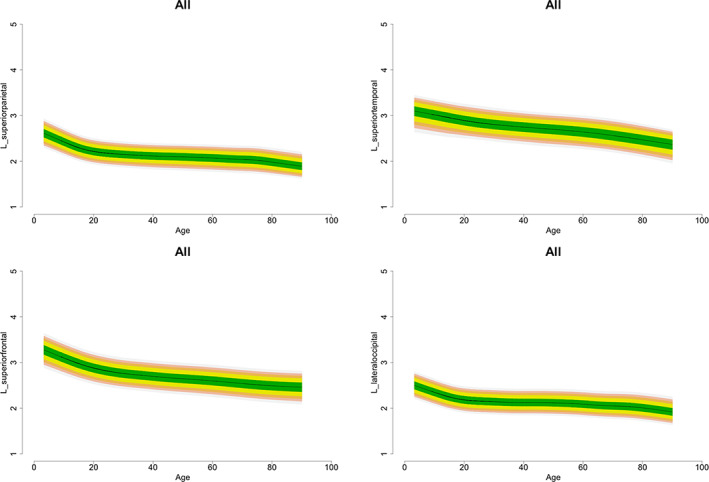
FIGURE 5.

Illustrative normative centile curves of cortical thickness. We present exemplar sets of centile curves for each lobe as derived from LMS of the entire data set. Normative centile curves for all cortical regions (for the entire data set and separately for males and females) are given in the supplementary material
