
Figure 4: Analysis of hematopoietic potential of hemogenic ECs derived from hESCs.
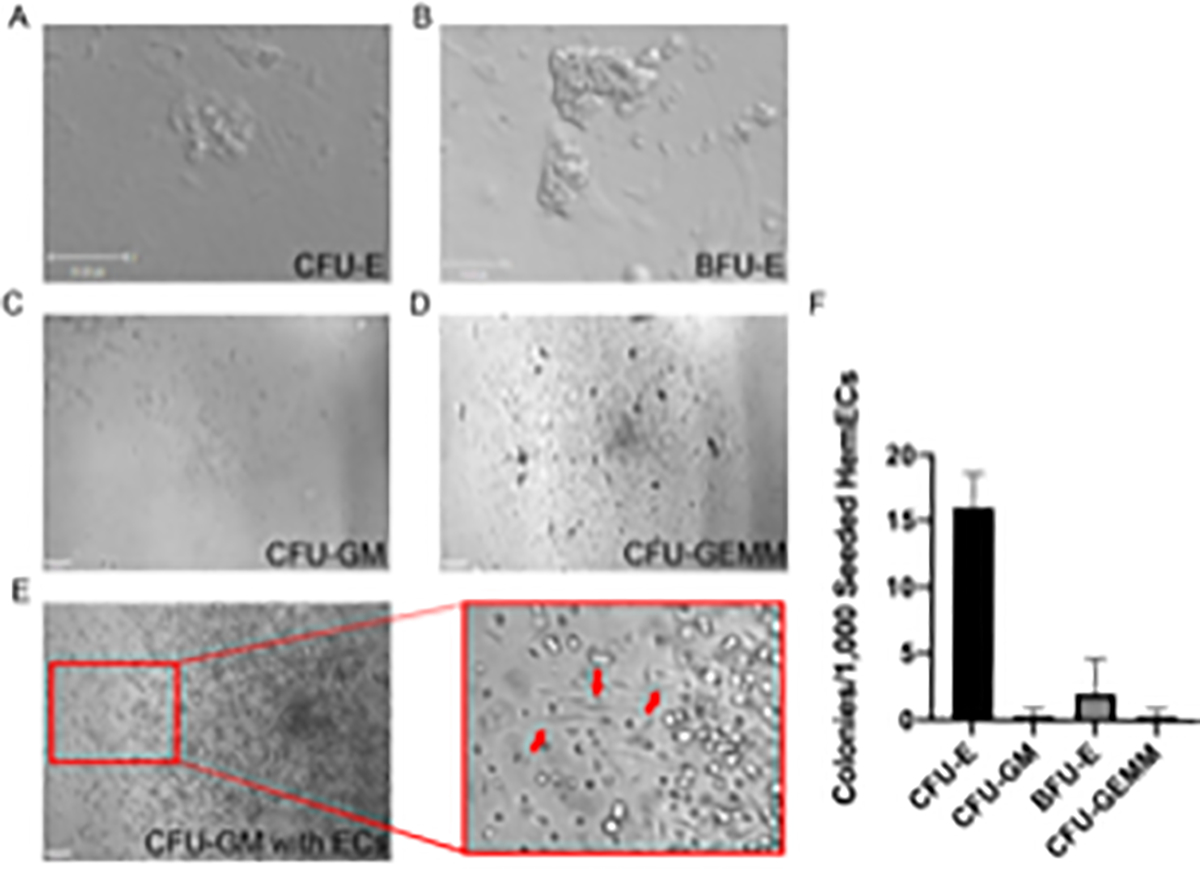
Representative images showing morphology of H1-hESC derived A) CFU-E erythroid colony (scale bar= 35 μm), B) BFU-E erythroid colony (scale bar= 75 μm), C) CFU-GM granulocyte/macrophage colony, D) CFU-GEMM multipotent hematopoietic progenitor colony, and E) CFU-GM granulocyte/macrophage colony with underlying endothelial cells (ECs) (red arrows). F) number and distribution of CFUs formed per 1000 plated hemogenic endothelial cells. Scale bar = 100 μm in C–E. Additional images of CFUs differentiated using this protocol can be found in Qiu et al.37. Panel F has been modified from Qiu et al.37 with permission from Elsevier.