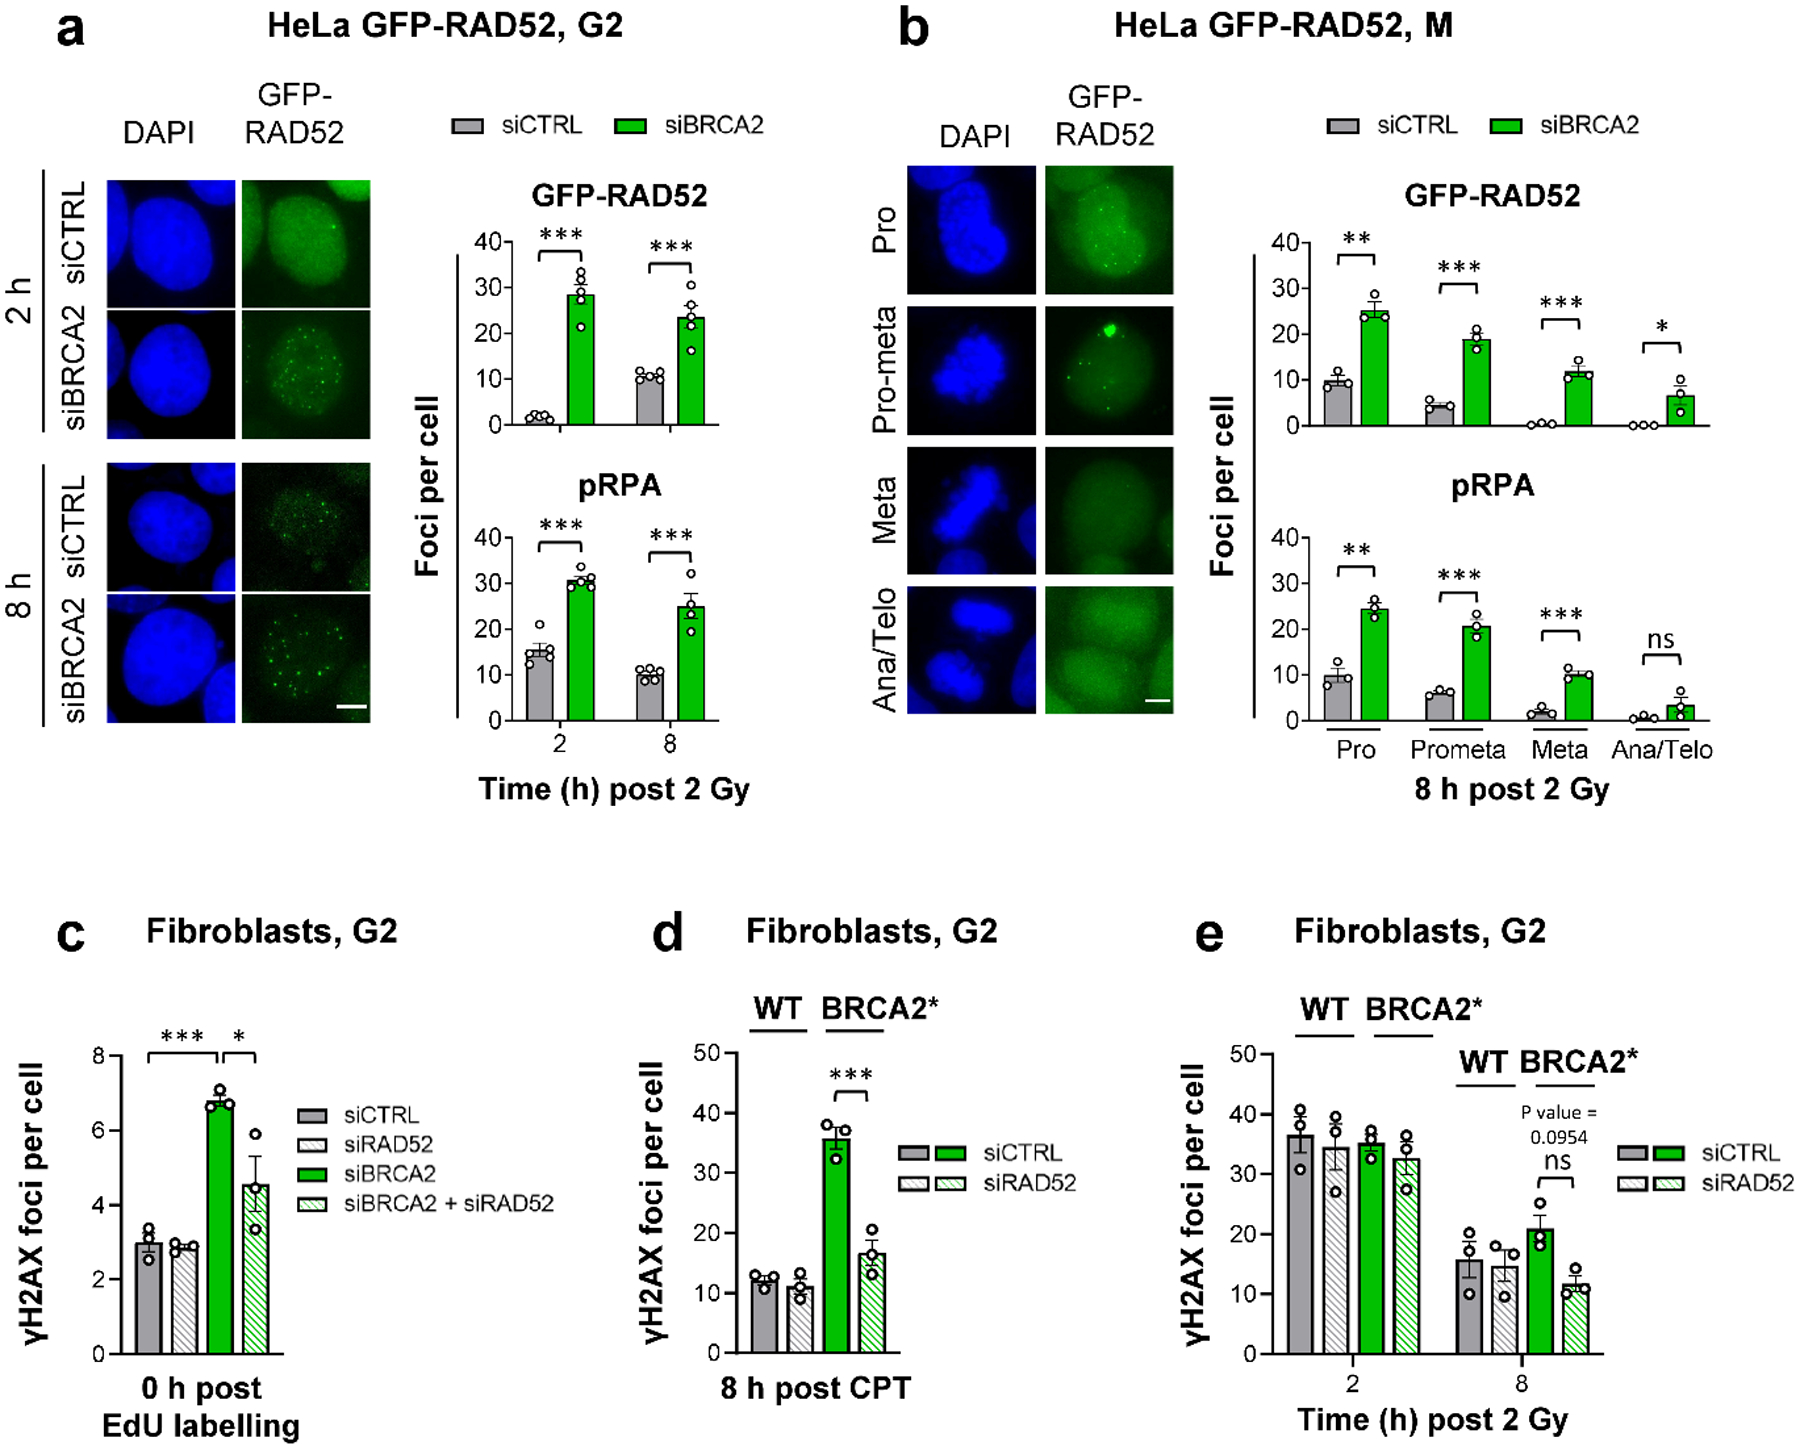
Figure 3 |. RAD52 locates to resected DSBs to prevent their repair in G2-phase BRCA2 mutants.

a, GFP-RAD52 and pRPA foci in G2 HeLa GFP-RAD52 cells. Cells stably expressing GFP-RAD52 (see Extended Data Fig. 3a) were transfected with siRNAs, labelled with EdU, irradiated with 2 Gy X-rays and EdU− G2 cells were analysed (see example IF images in the left panel, scale bar, 5 μm) (n=5 independent experiments, except pRPA for siBRCA2 at 8 h: n=4 independent experiments). b, GFP-RAD52 and pRPA foci in mitotic HeLa GFP-RAD52 cells. Experiments were done as in (a). EdU− mitotic cells were identified by their morphology seen in the DAPI staining (see example IF images in the left panel obtained from siCTRL-treated samples, scale bar, 5 μm) (n=3 independent experiments). c, Spontaneous γH2AX foci in G2 fibroblasts. 82–6 hTERT (WT) cells were transfected with siRNAs, labelled with EdU for 1 h and foci were immediately analysed after labelling in EdU− cells in G2. The specificity of the RAD52 siRNA was shown with siRNA resistant GFP-RAD52 HeLa cells (see Fig. 5a and Extended Data Fig. 7c) (n=3 independent experiments). d, γH2AX foci after CPT treatment in G2 fibroblasts. 82–6 hTERT (WT) and HSC-62 hTERT (BRCA2 mutant: BRCA2*) cells were transfected with siRNAs, treated with EdU and 20 nM CPT for 1 h. EdU+ cells were in S during the CPT treatment and progressed to G2 after 8 h. Foci were analysed in this population (n=3 independent experiments). e, γH2AX foci after IR in G2 fibroblasts. WT and BRCA2* cells were transfected with siRNAs, labelled with EdU and irradiated with 2 Gy X-rays. EdU− G2 cells were analysed (n=3 independent experiments). All data show the mean ± SEM. Individual experiments, each derived from 40 (G2) or 20 cells (M), are shown as dots. *: P < 0.05; **: P < 0.01; ***: P < 0.001, ns: non-significant (One-way ANOVA, except for the data in (a,b), where an unpaired two-tailed t-test was used). The exact P values are provided as source data. Source data are available online.
