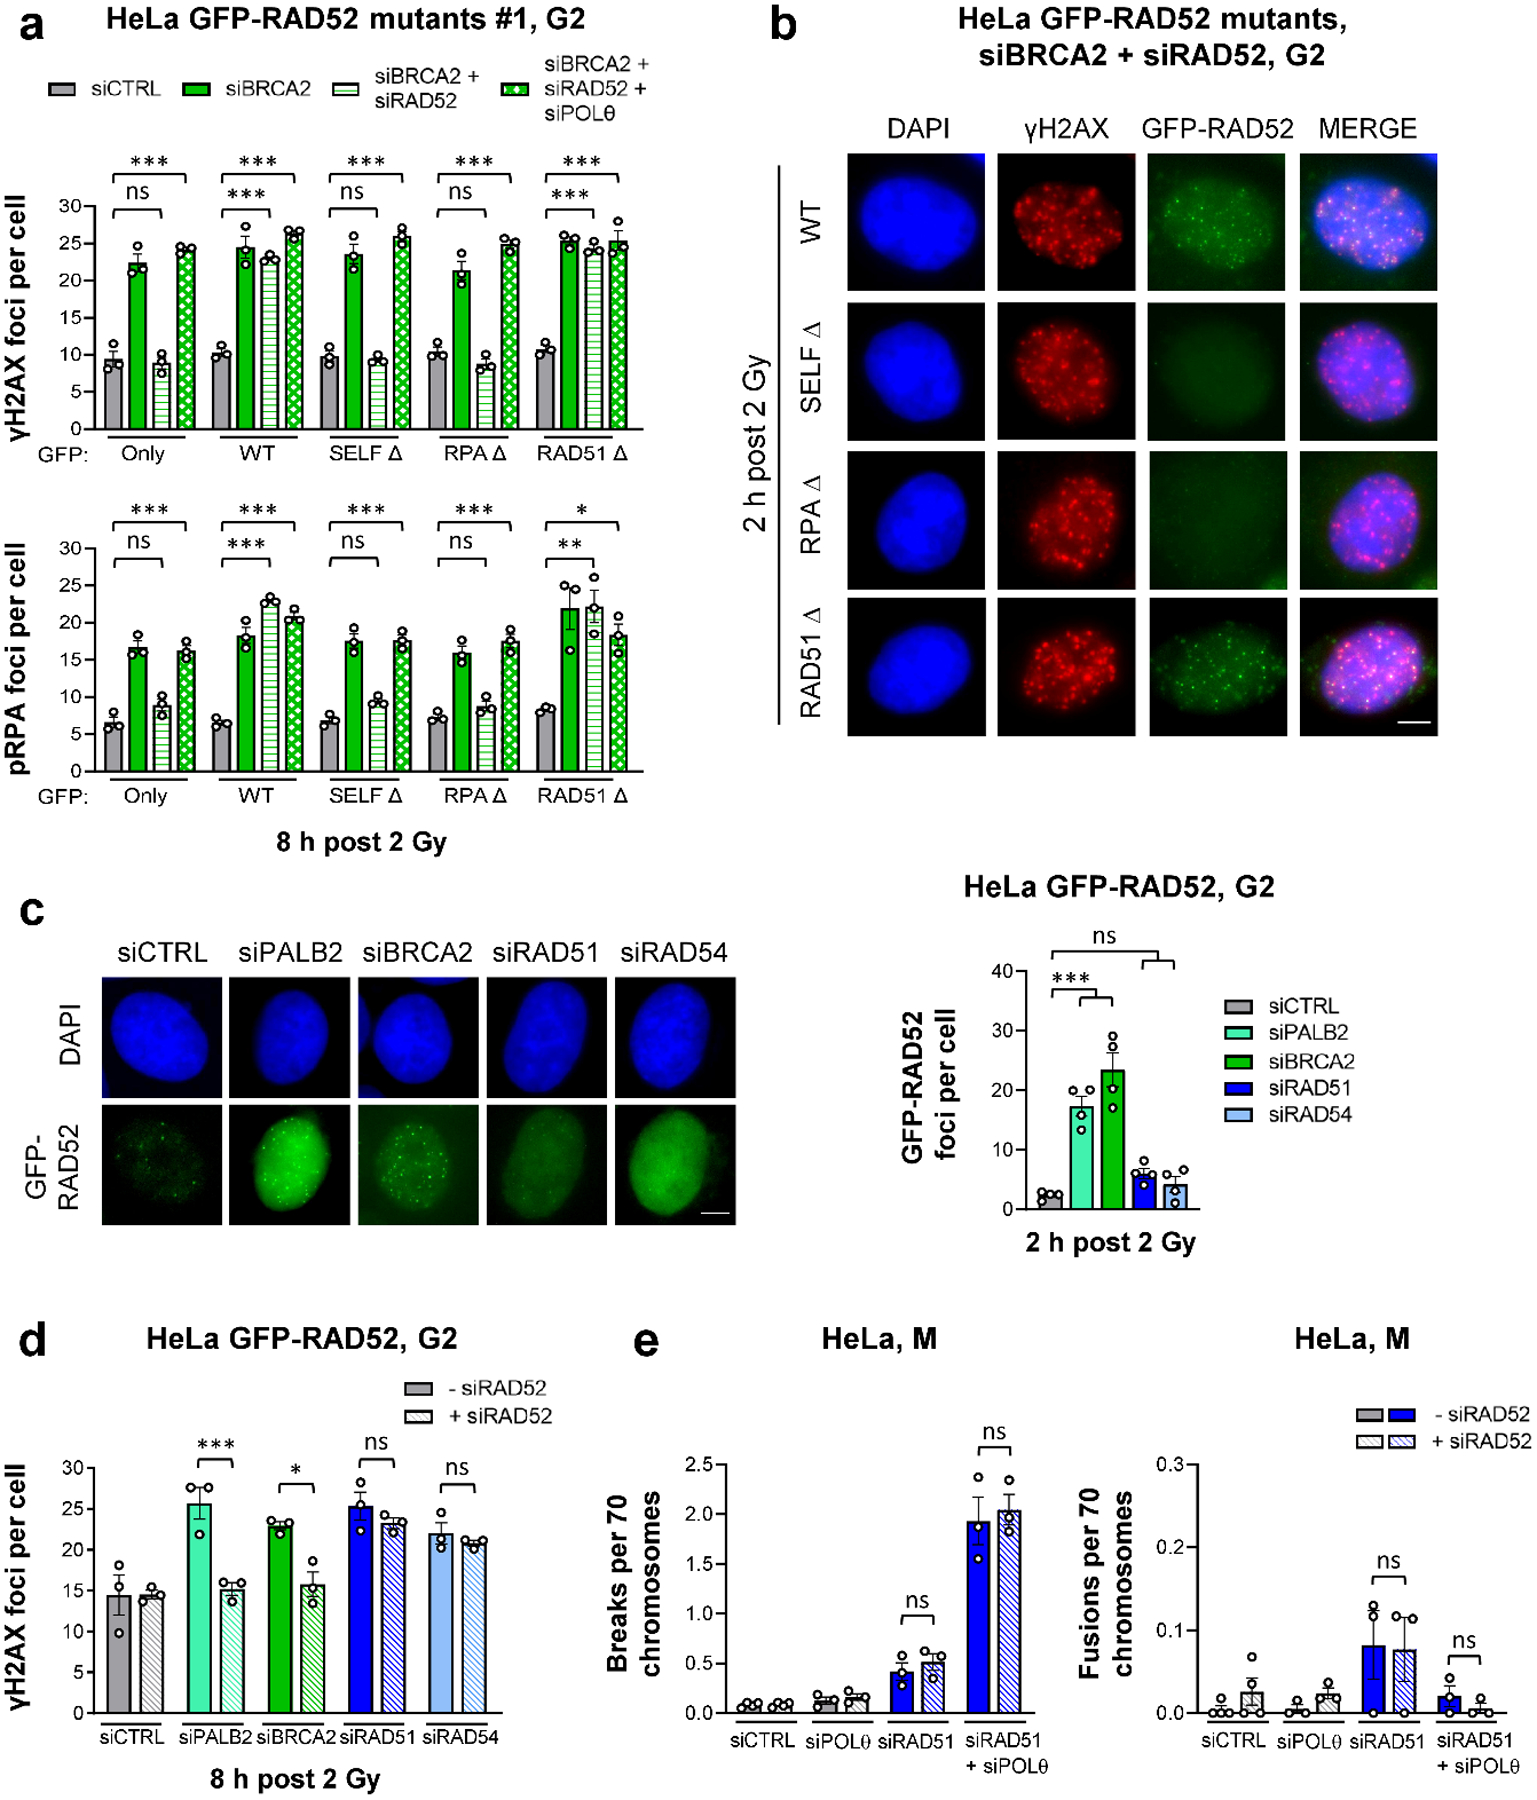
Figure 5 |. RAD52 and BRCA2 both suppress TMEJ.

a, γH2AX and pRPA foci in G2 HeLa cells stably expressing different GFP-RAD52 constructs (shown in Extended Data Fig. 7). Two independent clones for each mutant were used: Clone #1 is shown here, while Clone #2 is shown in Extended Data Fig. 7c. Cells were transfected with siRNAs, labelled with EdU, irradiated with 2 Gy X-rays and EdU−GFP+ cells in G2 were analysed (n=3 independent experiments). b, Example IF images of γH2AX and GFP-RAD52 foci for G2 HeLa cells carrying different GFP-RAD52 constructs. Cells were transfected with siRNAs, labelled with EdU, irradiated with 2 Gy X-rays and EdU−GFP+ G2 cells were analysed (scale bar, 5 μM). c, GFP-RAD52 foci in G2 HeLa GFP-RAD52 cells. Cells were transfected with siRNAs, labelled with EdU, irradiated with 2 Gy X-rays and EdU−GFP+ G2 cells were analysed (see example IF images in the left panel, scale bar, 5 μm) (n=4 independent experiments). d, γH2AX foci in G2 HeLa GFP-RAD52 cells. Cells were transfected with siRNAs, labelled with EdU, irradiated with 2 Gy X-rays and EdU− G2 cells were analysed (n=3 independent experiments). e, Spontaneous chromatid breaks and fusions in HeLa cells. Cells were transfected with siRNAs and mitotic spreads were prepared and analysed for the presence of aberrations. Chromatid breaks and fusions were quantified per spread and normalised to 70 chromosomes (n=3 independent experiments, except siCTRL/siRAD52: n=4 independent experiments). The data without siRAD51 are taken from Fig. 4d. All data show the mean ± SEM. Individual experiments, each derived from 40 (G2 foci) and 60 cells (M spreads), are shown as dots. *: P < 0.05; **: P < 0.01; ***: P < 0.001, ns: non-significant (One-way ANOVA). The exact P values are provided as source data. Source data are available online.
