Fig. 6.
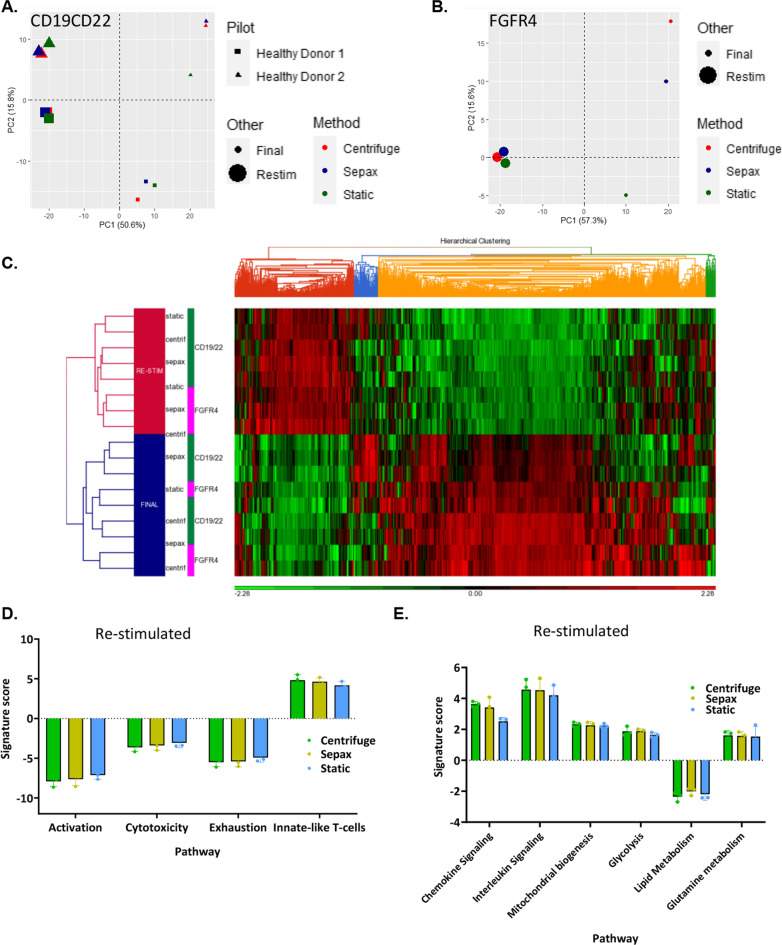
Gene expression of the final product post spinoculation vs re-stimulated CAR T cells are similar. PCA analysis PC1 vs PC2 comparing the different transduction methods and 8-day cultured samples to re-stimulated samples between two different healthy donors for CD19/22 transduction (A) and FGFR4 transduction (B). C Hierarchical clustering analysis of CD19/22 (C) and FGFR4 CAR T-cells before and after re-stimulation. Comparison of genes for Activation, Cytotoxicity, Exhaustion, ad Innate-like T cell functions were compared across each re-stimulated transduction method (D). Comparison of genes for Chemokine signaling, Interleukin Signaling, Mitochondrial biogenesis, Glycolysis, Lipid Metabolism, and Glutamine metabolism functions across each re-stimulated transduction method (E)

