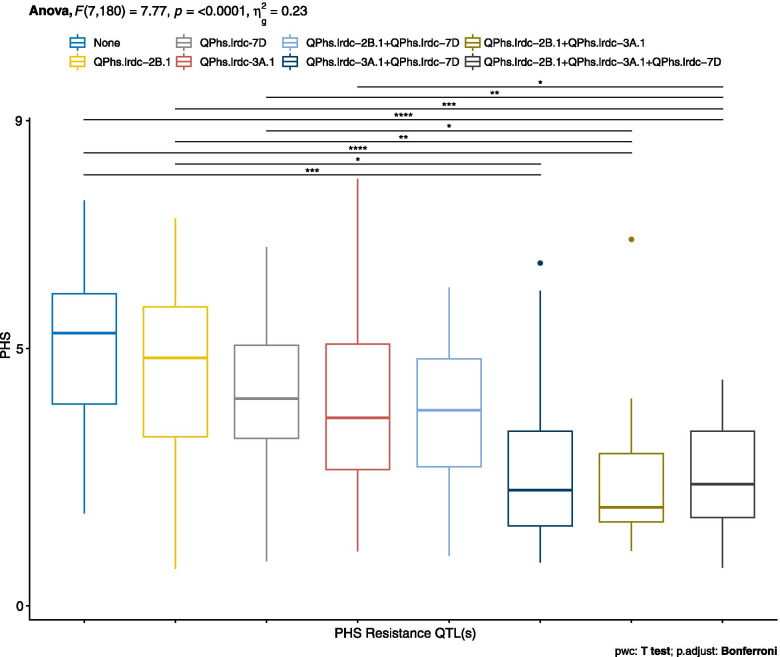
Fig. 4.
Boxplot distributions of pre-harvest sprouting (PHS) score in doubled haploid (DH) population. All DH lines produced from the cross AAC Innova/AAC Tenacious were grouped into eight different genotypic (QTL) classes based on three major QTLs QPhs.lrdc-2B.1, QPhs.lrdc-3A.1 and QPhs.lrdc-7D. Effects of positive alleles of single QTL and their combinations on average PHS score are represented alongside negative alleles at all three loci using the pooled phenotypic data (average of all environments). Statistically significant differences among QTLs/QTL combinations were calculated by ANOVA, pairwise T test with Bonferroni corrections and shown by asterisk. Quartiles and medians are represented by boxes and continuous lines, respectively. Whiskers extend to the farthest points that are not outliers, whilst outliers are shown as dots

