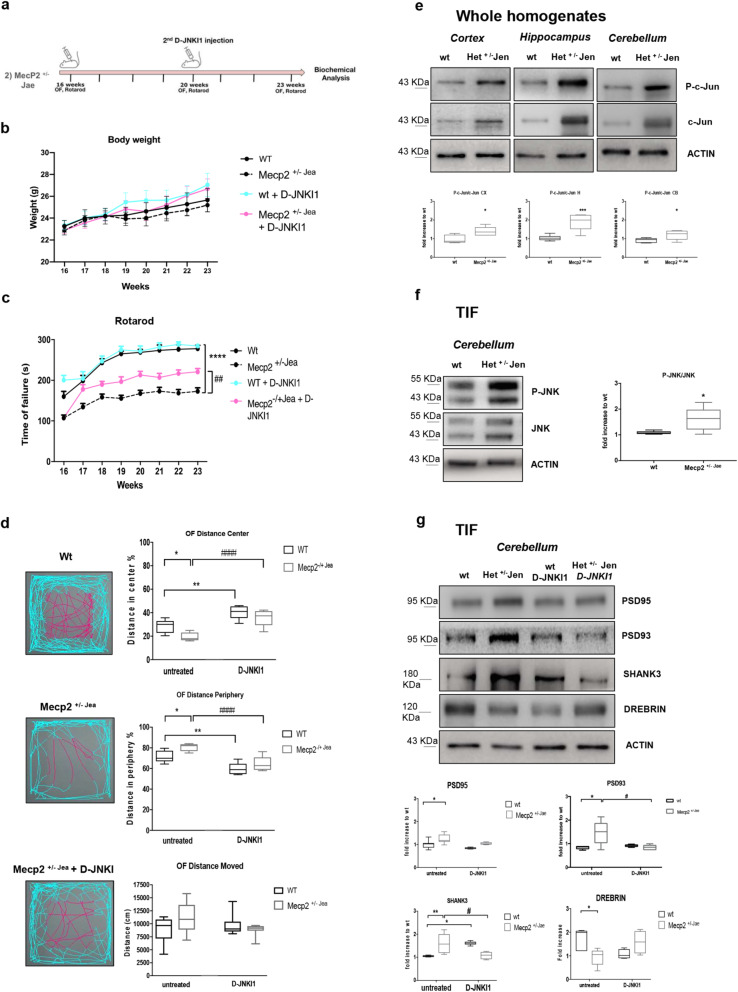
Fig. 4.
Female Mecp2+/− Jaenisch neurological phenotype: JNK signaling activation and D-JNKI1 treatment. a Timeline of D-JNKI1 treatment in Female Mecp2+/− Jaenisch mice. b Growth curves of D-JNKI1-treated and untreated wt and Mecp2+/− Jae mice from 16 to 23 weeks of age. c Rotarod tests in D-JNKI1 Mecp2+/− Jae-treated mice (fuchsia line), Mecp2+/− Jae untreated (black dotted line), treated wt (blue-sky line), and untreated wt (black line). d Open field test. D-JNKI1 improved the behavioral performance of Mecp2+/− Jae (see plots for central (fuchsia) and peripheral (blue sky) movements of wt and Mecp2+/− Jae-treated and untreated mice). The last graph presented the distance moved: there were no genotypic differences. e Western blots and quantifications of c-Jun activation in the whole homogenate of the cortex, hippocampus, and cerebellum in 23-week-old wt and Mecp2+/− Jae mice. f Western blots and relative quantifications in the TIF cerebellum of 23-week-old wt and Mecp2+/− Jae mice confirmed JNK activation at the synaptic level in Mecp2+/− Jae mice. g Mecp2+/− Jae presented alterations of the PSD-region and D-JNKI1 treatment normalized the biochemical alterations in treated vs untreated Mecp2+/− Jae mice. Each experimental group: n=8. Data were shown as mean ± SEM. Significance was calculated using two‐way ANOVA for repetitive measurements followed by Bonferroni post hoc test (panels a, b, c), Student’s t test followed by Tukey’s post hoc test (panels d and e), and two‐way ANOVA followed by Bonferroni post hoc test (f). Significant differences from control *p<0.05, **p<0.01, ***p<0.001, and ****p<0.0001; D-JNKI1-treated vs untreated Mecp2+/−: #p<0.05, ##p<0.01, and #### p<0.0001

