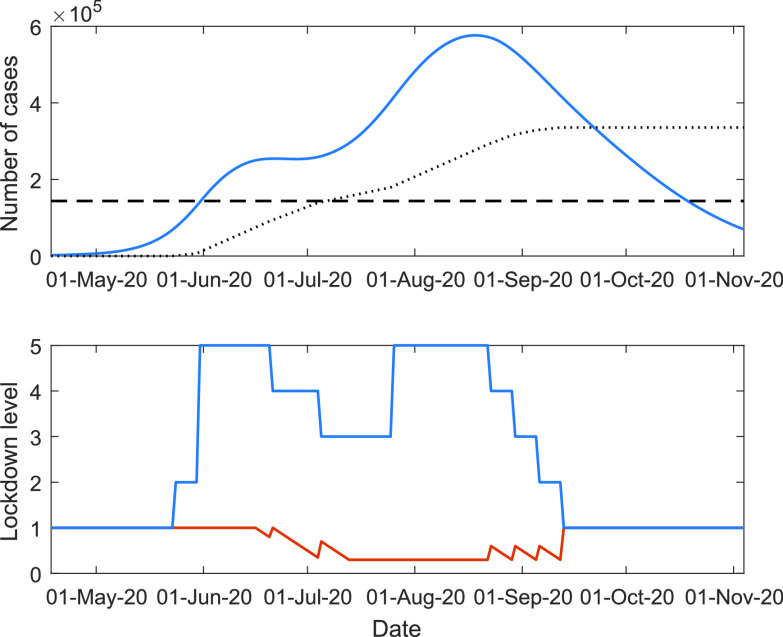
FIGURE 7.
Simulation results for the balancing lives and livelihoods policy with waning compliance to regulations. The top panel shows the active number of confirmed infectious cases along with the number of ICU beds imposed high limit (dashed line) and weighted cumulative economic impact (dotted line) over time and the bottom panel shows the lockdown level (blue) and compliance (orange) over time.

