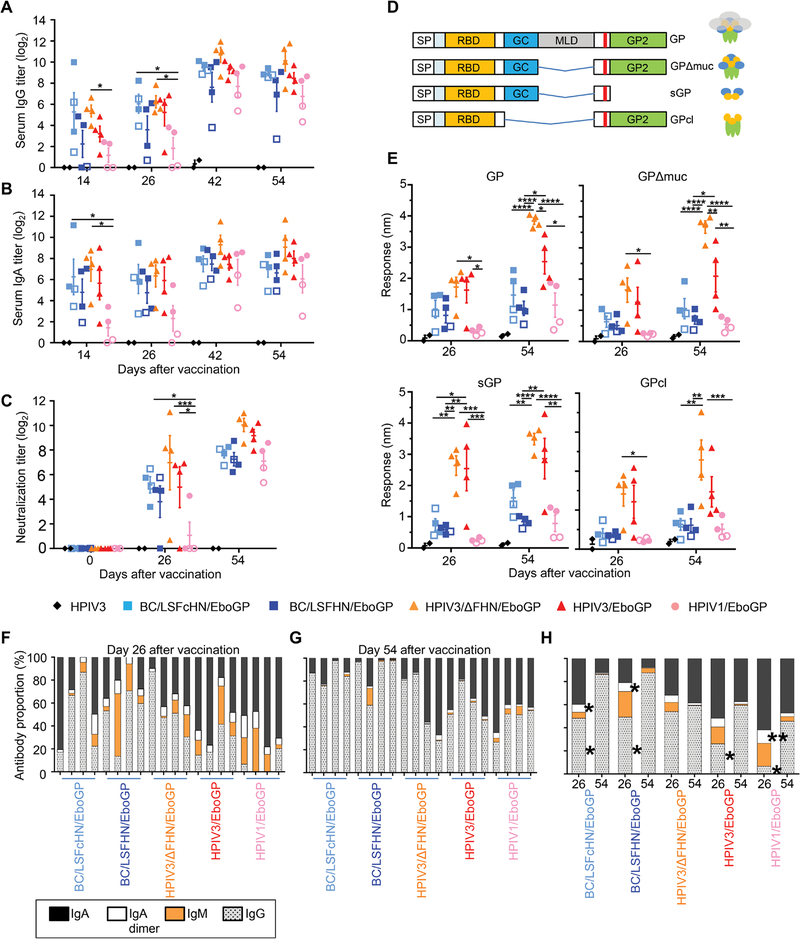
Fig. 2. Serum antibody responses in vaccinated NHP.
(A to C) Total GP-specific IgG (A) and IgA (B) in serum and serum EBOV neutralization titers (C) were measured in vaccinated groups before EBOV infection using ELISA and plaque reduction assays, respectively. Post-vaccination ELISA titers were corrected by subtraction of respective preimmune sera baseline values. Open symbols indicate nonsurviving animals. Bars denote group means ± SEM. (D) Schematic of the truncated GP forms evaluated by BLI. (E) Maximum response of total post-vaccination sera binding to the different truncated GP forms using BLI. (F and G) Proportion of the antibody isotypes in the total GP-specific antibody response for each NHP at days 26 (F) and 54 (G). IgA (black), IgA dimer (white), IgM (orange), and IgG (gray). Each bar represents an individual NHP. (H) Average isotype proportions for each vaccine group at days 26 and 54. Significance was measured by a two-way ANOVA with (A) to (C) and (E) Tukey’s correction or (H) Sidak’s correction for multiple comparisons. *P ≤ 0.05, **P ≤ 0.01, ***P ≤ 0.001, and ****P ≤ 0.0001.

