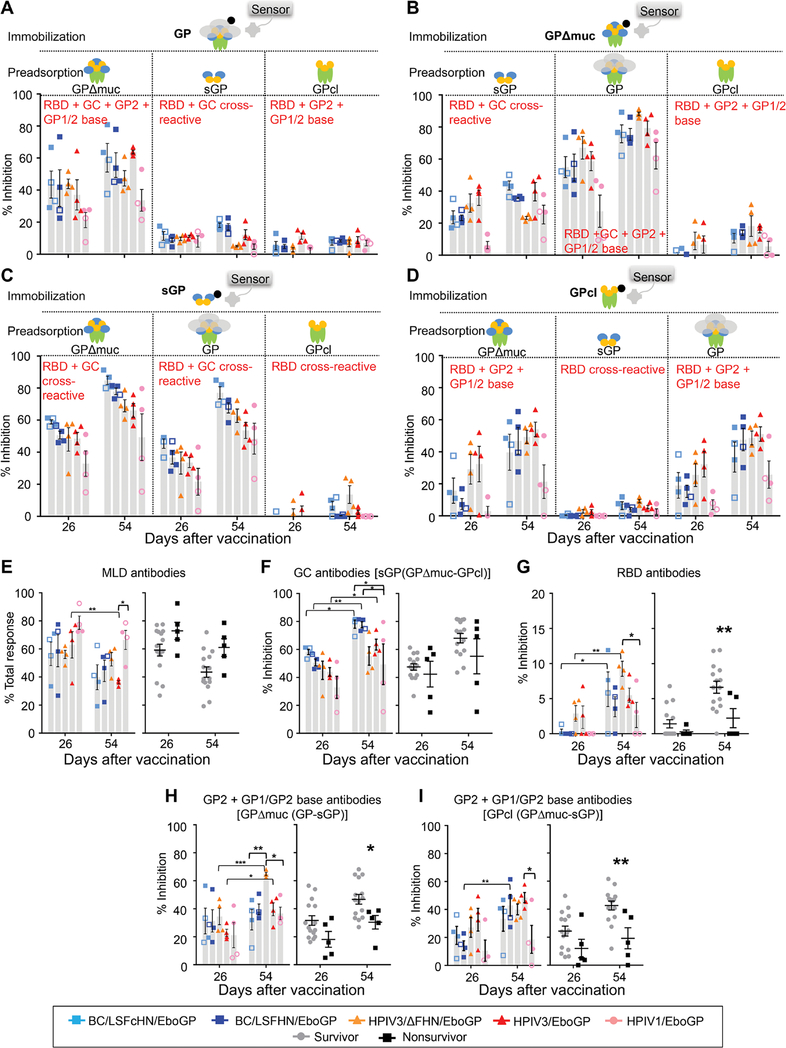
Fig. 3. Distribution of serum antibodies binding to EBOV GP antigenic domains.
(A to D) Results of BLI assays of sera binding to different immobilized biotinylated GP forms after sera preadsorption with various GP forms are shown. Binding inhibition to immobilized GP (A), GPΔmuc (B), sGP (C), and GPcl (D) after preadsorption of serum with GP forms indicated in each figure panel, expressed as a percentage of total binding response (in nanometers) obtained without sera preadsorption. (E) MLD domain antibodies according to vaccine groups or survivors (n = 15) versus nonsurvivors (n = 5). (F) GC antibodies in vaccine groups or survivors and nonsurvivors; binding to biotinylated sGP, inhibited by GPcl adsorption (targeted to the RBD), was subtracted from the binding removed by GPΔmuc adsorption (targeted to the GC and RBD). (G) RBD antibodies in vaccine groups or survivors versus nonsurvivors. (H and I) Proportion of GP2 + GP1/GP2 base antibodies for vaccine groups or survivors versus nonsurvivors, calculated by either subtracting percent binding inhibition to GPΔmuc caused by sGP from the percent inhibition caused by GP (H) or subtracting percent binding inhibition to GPcl caused by sGP from the percent inhibition caused by GPΔmuc (I). NHPs were organized according to groups (symbols, open symbols denote nonsurvivors; and gray bars represent mean values ± SEM) or survivors (gray circles) and nonsurvivors (black squares) ± SEM. (E to I) Significance measured by two-way ANOVA with post hoc tests for multiple comparisons between vaccine groups at a given time point (Tukey’s correction) or between time points and between survivors and nonsurvivors (Sidak’s correction). *P ≤ 0.05, **P ≤ 0.01, and ***P ≤ 0.001.

