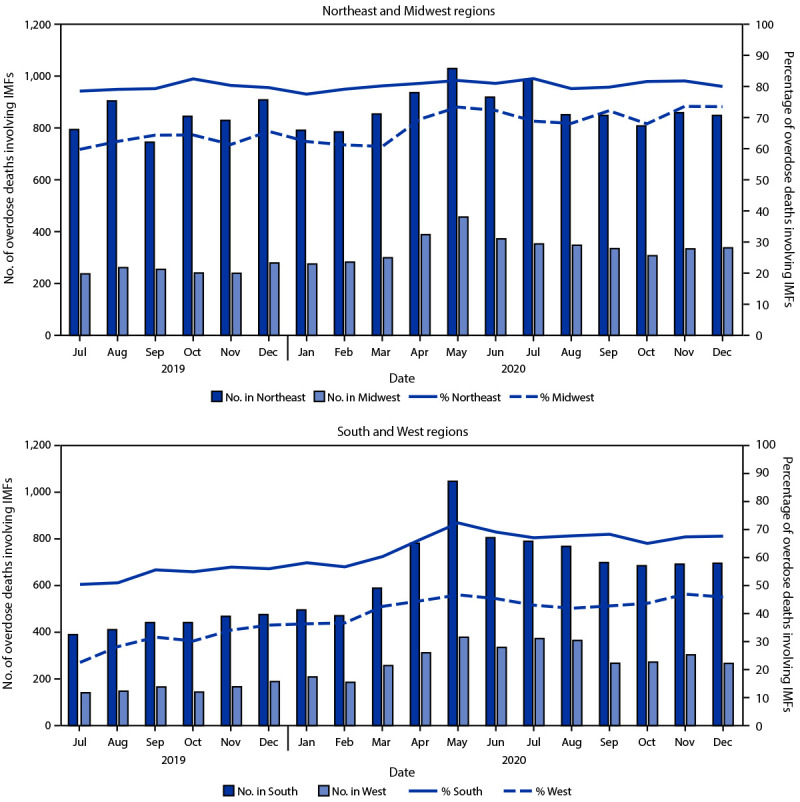
FIGURE 1.

Number and percentage of drug overdose deaths involving illicitly manufactured fentanyls,* by month and geographic region† — State Unintentional Drug Overdose Reporting System, 30 jurisdictions,§ July 2019–December 2020
Abbreviations: IMFs = illicitly manufactured fentanyls; SUDORS = State Unintentional Drug Overdose Reporting System.
* Includes illicitly manufactured fentanyl and fentanyl analogs.
† Northeast: Connecticut, Maine, Massachusetts, New Hampshire, New Jersey, Pennsylvania, Rhode Island, and Vermont; Midwest: Illinois, Kansas, Minnesota, Missouri, and South Dakota; South: Delaware, District of Columbia, Georgia, North Carolina, Oklahoma, Tennessee, Virginia, and West Virginia; West: Alaska, Arizona, Colorado, Montana, Nevada, New Mexico, Oregon, Utah, and Washington.
§ Illinois, Missouri, Pennsylvania, and Washington reported deaths from counties that accounted for ≥75% of drug overdose deaths in the state in 2017, per SUDORS funding requirements; all other jurisdictions reported deaths from the full jurisdiction.
