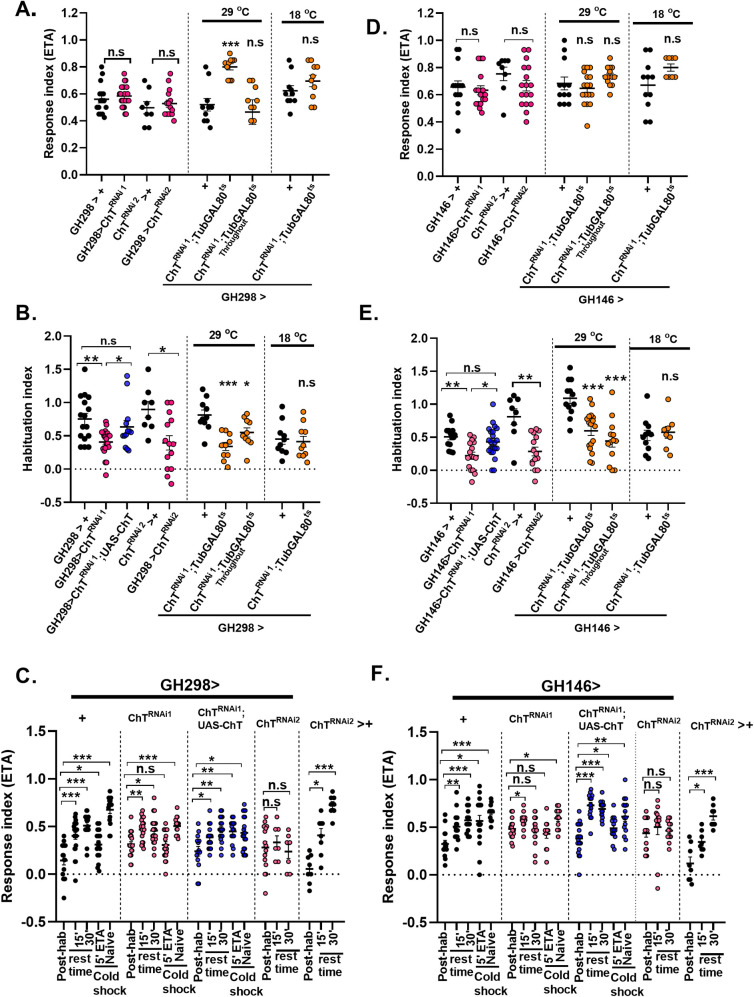
Fig 5. Presence of ChT in antennal lobes and projection neurons is required for olfactory habituation.
GH298GAL4 was used as a driver line for expression in AL (A) response index, (B) habituation index of genotypes: GH298> UAS-ChTRNAi1 (pink circles), GH298> UAS-ChTRNAi1;UAS-ChT (blue circles) as compared to its control GH298> + (black circles). GH298> UAS-ChTRNAi2 (pink circles) as compared to UAS-ChTRNAi2>+ (black circles). GH298>ChTRNAi1;TubGAL80ts at 29°C where ChT was knocked down only in 3rd instar foraging developmental window or throughout 29°C (orange circles) as compared to GH298>+ (black circles). Scatter plot also shows data of genotypes GH298>ChTRNAi1;TubGAL80ts at 18°C (orange circles) as compared to GH298>+ (black circles) at 18°C. Chemotaxis remains unaltered except in the condition when ChT was knocked down only in 3rd instar developmental window while a significant reduction in habituation index was observed when ChT was knocked down in AL neurons marked by GH298 driver line. (C) response index following 5’ ETA exposure (post-hab), spontaneous recovery in the ETA pre-exposed larvae after 15 and 30 min rest time in the absence of stimulus, dishabituation in the ETA pre-exposed larvae presented to 1 min cold shock (5’ETA+coldshock) and naïve larvae presented to 1 min cold shock (naïve + cold shock), of the genotypes: GH298> + (black circles), GH298> UAS-ChTRNAi1 (pink circles), GH298> UAS-ChTRNAi1;UAS-ChT (blue circles), GH298> UAS-ChTRNAi2 (pink circles) and UAS-ChTRNAi2>+ (black circles). Knock-down of ChT impairs spontaneous recovery and dishabituation when ChT was knock down with GH298GAL4 driver. GH146GAL4 was used as a driver line for expression in PN. (D and E) shows response index and habituation index, respectively, in genotypes: GH146> UAS-ChTRNAi1 (pink circles), GH146> UAS-ChTRNAi1;UAS-ChT (blue circles) as compared to its control GH146> + (black circles). GH146> UAS-ChTRNAi2 (pink circles) as compared to UAS-ChTRNAi2>+ (black circles).GH146>ChTRNAi1;TubGAL80ts at 29°C where ChT was knocked down only in 3rd instar foraging developmental window or throughout 29°C (orange circles) as compared to GH146>+ (black circles). Scatter plot also shows data of genotypes GH146>ChTRNAi1;TubGAL80ts 18°C (orange circles) as compared to GH146>+ (black circles) at 18°C. A significant reduction in habituation index was observed while chemotaxis remains unaltered when ChT was knocked down in PNs. (F) response index following 5’ ETA exposure (post-hab), spontaneous recovery in the ETA pre-exposed larvae after 15 and 30 min rest time in the absence of stimulus, dishabituation in the ETA pre-exposed larvae presented to 1 min cold shock (5’ETA+coldshock) and naïve larvae presented to 1 min cold shock (naïve + cold shock), of the genotypes: GH146> + (black circles), GH146> UAS-ChTRNAi1 (pink circles), GH146> UAS-ChTRNAi1;UAS-ChT (blue circles), GH146> UAS-ChTRNAi2 (pink circles) and UAS-ChTRNAi2>+ (black circles). Knock-down of ChT impairs spontaneous recovery and dishabituation when ChT was knock down in PNs with GH146GAL4 driver. Each N represent one experiment performed with a group of 30–40 larvae. Each data group was analysed for normal distribution using Shapiro-Wilk test. Statistical significance was determined by two-tailed unpaired t-test (parametric) with Welchs correction. *** represent p≤0.0001, ** represent p≤0.001, n.s means statistical non-significance when p≥0.05. For more statistical details and numerical data values in the scatter plot refer to S1 and S2 Data.

