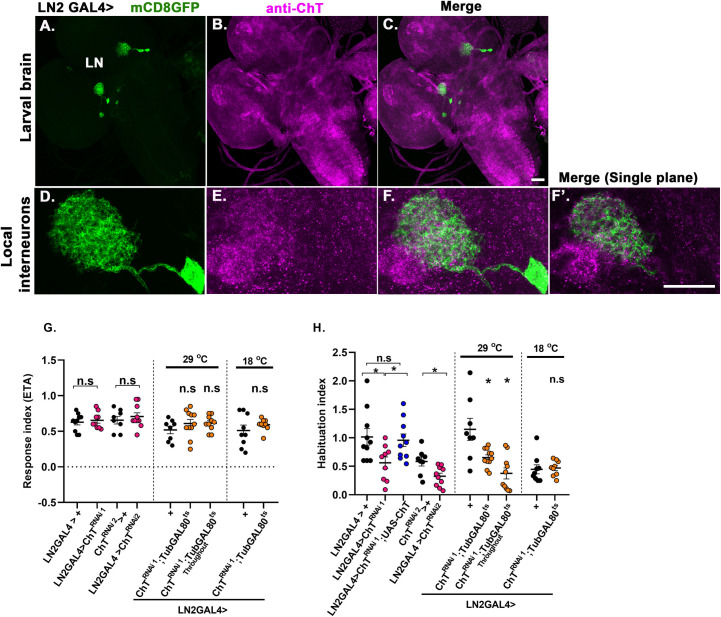
Fig 6. Presence of ChT in local interneurons is required for olfactory habituation but not chemotaxis.
(A-C) Expression of UAS-mCD8GFP in local interneurons (green) driven by LN2GAL4 and immunostained with anti-ChT (magenta) and merge, imaged with 20x, 0.9 N.A objective, scale bar 50 μm.(D-F) local interneurons imaged at higher magnification, scale bar 20 μm, imaged with 40x, 1.4N.A oil objective. (F’) represents the merged image of single plane taken from the same z-section of represented image stacks. The colocalised regions can be viewed as white areas in the merged image shown. All images are z-stacked (unless mentioned) pseudocoloured representative of 3–5 3rd instar larval brains. (G) response index, (H) habituation index in genotypes: LN2> UAS-ChTRNAi1 (pink circles), LN2> UAS-ChTRNAi1;UAS-ChT (blue circles) as compared to its control LN2> + (black circles). LN2> UAS-ChTRNAi2 (pink circles) as compared to UAS-ChTRNAi2>+ (black circles). LN2>ChTRNAi1;TubGAL80ts at 29°C where ChT was knocked down only in 3rd instar foraging developmental window or throughout 29°C (orange circles) as compared to LN2>+ (black circles). Scatter plot also shows data of genotypes LN2>ChTRNAi1;TubGAL80ts 18°C (orange circles) as compared to LN2>+ (black circles) at 18°C. A significant reduction in habituation index was observed while chemotaxis remains unaltered when ChT was knocked down in local interneurons. Each N represent one experiment performed with a group of 40 larvae. Each data group was analysed for normal distribution using Shapiro-Wilk test. Statistical significance was determined by two-tailed unpaired t-test (parametric) with Welchs correction. * represent p≤0.05, n.s means statistical non-significance when p≥0.05. For exact statistical details and numerical data values in the scatter plot refer to S1 and S2 Data.

