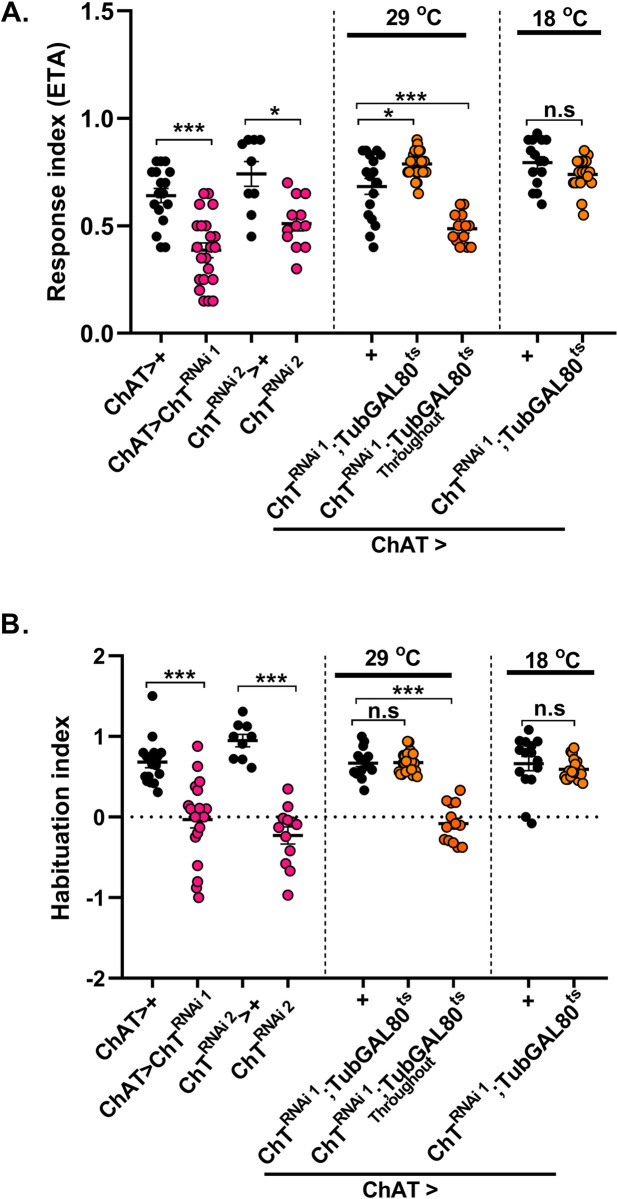
Fig 9. Knockdown of ChT in cholinergic neurons does not impair olfactory habituation.
(A and B) shows response index and habituation index in larvae of genotypes: ChATGAl4>UAS-ChTRNAi1 (pink circles) as compared to its control ChATGAL4>+ (black circles). ChATGAl4> UAS-ChTRNAi2 (pink circles) as compared to UAS-ChTRNAi2>+ (black circles), ChATGAl4 > UAS-ChTRNAi1;TubGAL80ts at 29°C where ChT was knocked down only in 3rd instar foraging developmental window or throughout 29°C (orange circles) as compared to ChATGAl4>+ (black circles). Scatter plot also shows data of genotypes ChATGAl4>ChTRNAi1;TubGAL80ts at 18°C (orange circles) as compared to ChATGAl4>+ (black circles) at 18°C. ChT knockdown throughout development either by expression of UAS-ChTRNAi1 or UAS-ChTRNAi2 leads to significantly reduced chemotaxis and habituation. ChT knockdown specifically at 3rd instar development stage leads to enhanced chemotaxis but habituation remains unaltered. Each N in scatter plot represent one experiment performed with a group of 40 larvae. Each data group was analysed for normal distribution using Shapiro-Wilk test. Statistical significance was determined by two-tailed unpaired t-test (parametric) with Welchs correction. *** represent p≤0.0001, * represent p≤0.001, n.s means statistical non-significance when p≥0.05. For exact statistical details and numerical data values in the scatter plot refer to S1 and S2 Data.

