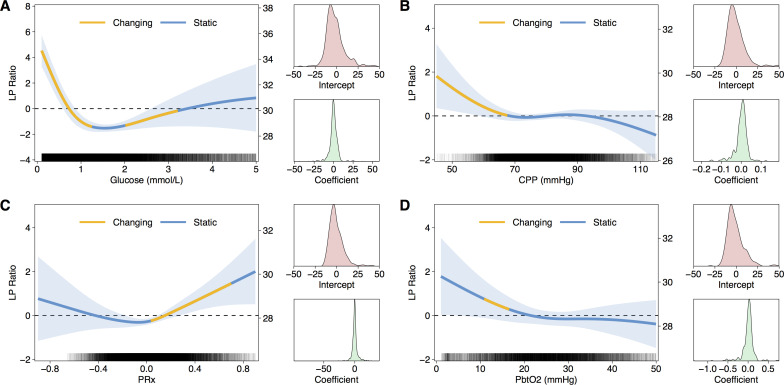
Fig 4. Relationship between lactate-pyruvate ratio (LPR) and other physiological parameters.
In each panel a GAMM fit of glucose (A), CPP (B), PRx (C), and PbtO2 (D) against LPR is plotted. On the left axis LPR is scaled to zero mean without the intercept term; on the right axis the scale includes the overall intercept. Shaded region indicates 95%CI for the fit. The regions of each curve highlighted in yellow indicate non-zero first derivative i.e. where the is significant change. Alongside each plot is the distribution of random effects for intercept and slope/coefficient. Rug plot within in each panel indicates density of data.

