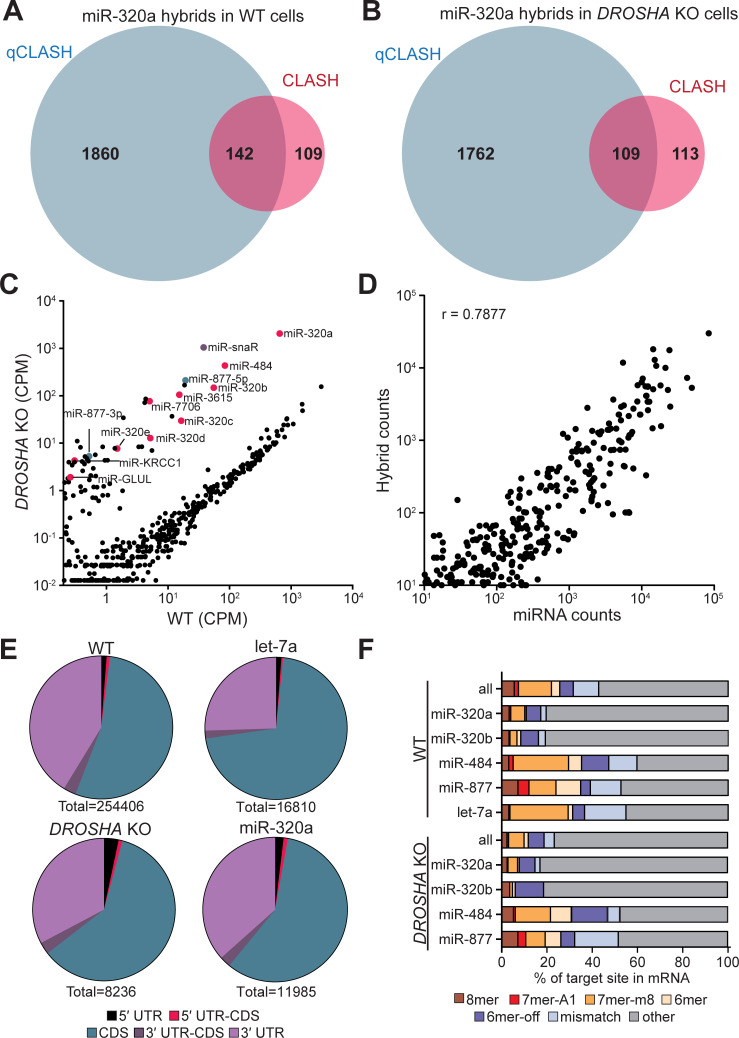
Fig 2. Analysis of AGO-qCLASH in HCT116 colorectal cancer cells.
Venn diagram depicting the overlap of miR-320a target genes in qCLASH and CLASH for (A) WT cells and (B) DROSHA KO cells. (C) Normalized read count of miRNAs in HCT116 and HCT116 DROSHA KO cells. miRNA counts were determined with miR-Deep2 and normalized to total reads. TSS-miRNAs are labeled in magenta, mirtrons are labeled in green, miR-snaR is labeled in purple, and all other miRNAs are labeled in black. (D) Correlation plot of miRNA abundance and hybrid counts for each miRNA. miRNA counts were determined using miR-Deep2 and normalized to total number of reads. The number of hybrids for each miRNA was determined and plotted against miRNA counts. A correlation coefficient (r) is provided. (E) miRNA target sites are found predominately in the CDS and 3′UTR. The location of each transcript from the mRNA portion of the hybrid was determined using data from Ensemble Biomart. Each hybrid was assigned a location based on where it was located in relation to the beginning and end of the reference CDS. Transcripts with IDs not found in the database were excluded from the analysis. (F) The proportion of hybrids with seed binding was less than non-canonical pairings. Seed binding was determined using viennad files, which predicts folding between the miRNA and its target. Individual miRNAs display distinct distributions of seed bindings.

