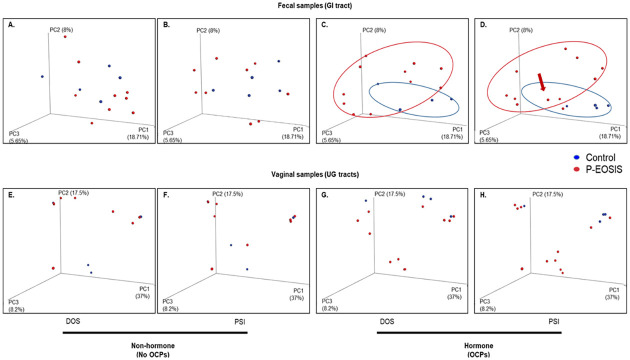
Fig 2. Principal Coordinates Analysis (PCoA).
PCoA shows the distribution of GI (fecal samples) and UG (vaginal samples) bacterial communities on the day of surgery (DOS) and post-surgery intervention (PSI) for patients with endometriosis (P-EOSIS) and controls subjects (control) that were receiving or not receiving hormonal treatment (OCPs). PC1, PC2 and PC3 were plotted on the x, y and z axes. A., E. (DOS), B., F. (PSI): Non-hormone (fecal: n = 9, vagina: n = 14). C., G. (DOS), D., H. (PSI): Hormone (fecal: n = 20, vagina: n = 15).

