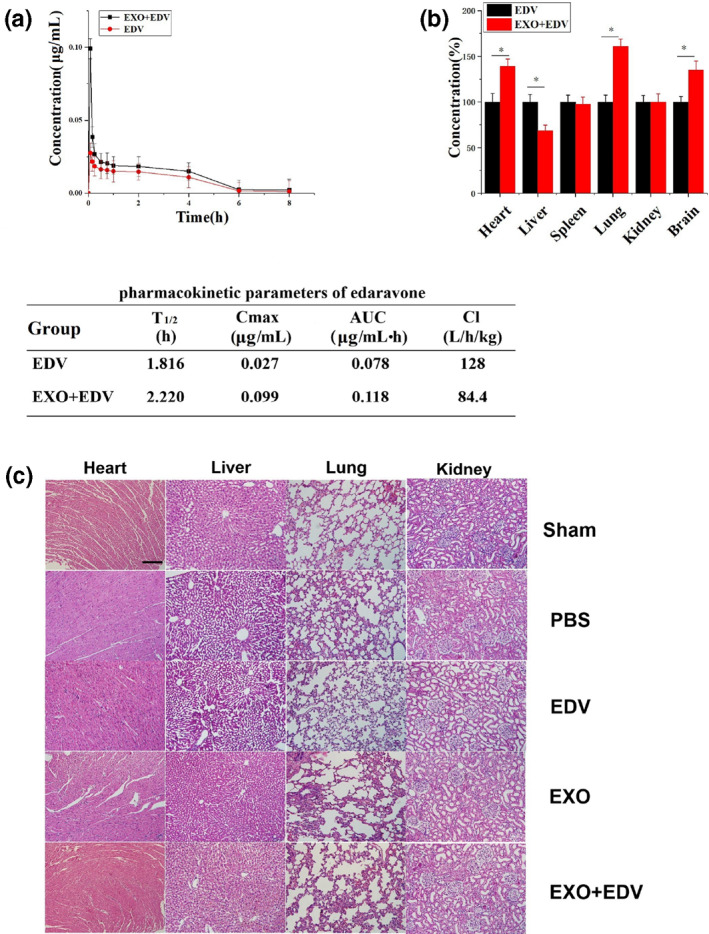
FIGURE 2.

Biodistribution of EXO + EDV and EDV in vivo. (a) The drug concentration–time curve and PK parameters of EDV in rat plasma after single iv administration of EDV and EXO + EDV at the concentration of EDV (10 mg/kg). Data are expressed as means ± SD (n = 3). (b) Tissue distributions of EDV in rats treated with EDV and EXO + EDV at 8 h after single iv administration. The concentrations of exosomal EDV in different organs were quantified by comparing with the concentration of EDV in organs in EDV treated group as the control group (100%). Data are expressed as means ± SD (n = 3), *P < 0.05. (c) H&E staining of heart, liver, lung and kidney tissue sections in 8 h after iv administering a single dose of different EDV formulations. The scale bar is 200 μm and applies to all figure parts
