FIGURE 12.

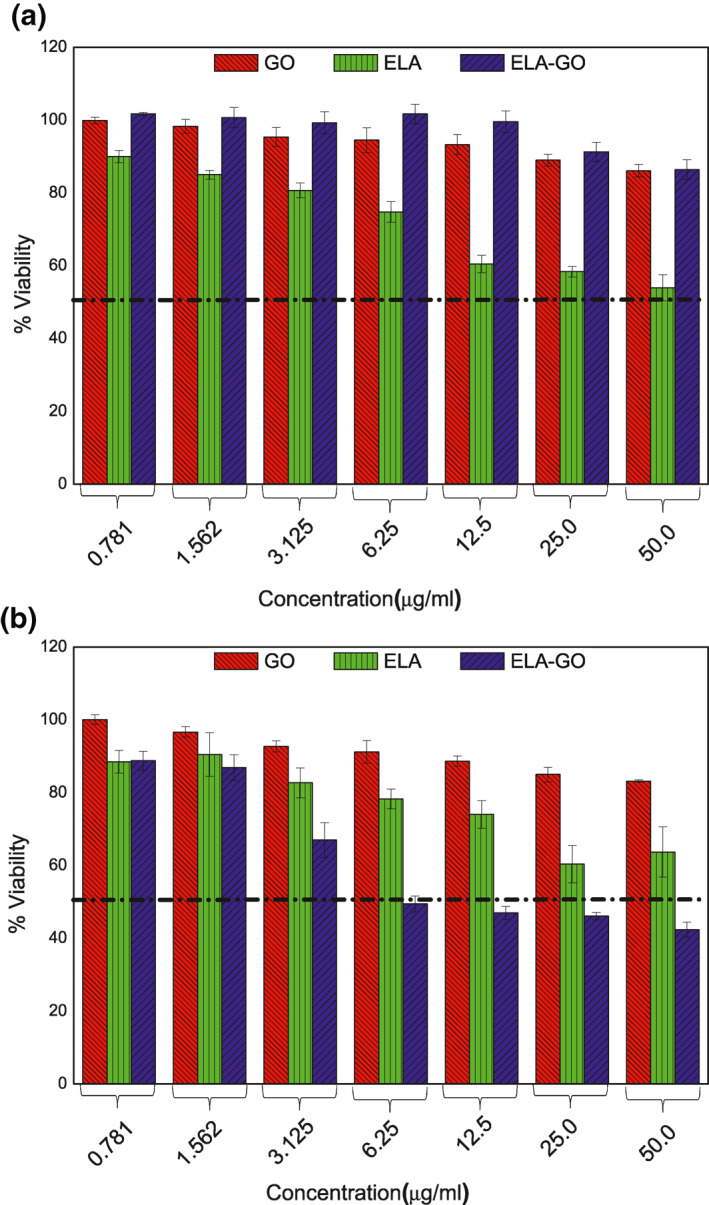
The cytotoxicity profiles for the ellagic acid (ELA), graphene (GO) and ELA‐GO nanocomposite after treatment of 3T3 cells (a) and B16 cells (b)

The cytotoxicity profiles for the ellagic acid (ELA), graphene (GO) and ELA‐GO nanocomposite after treatment of 3T3 cells (a) and B16 cells (b)