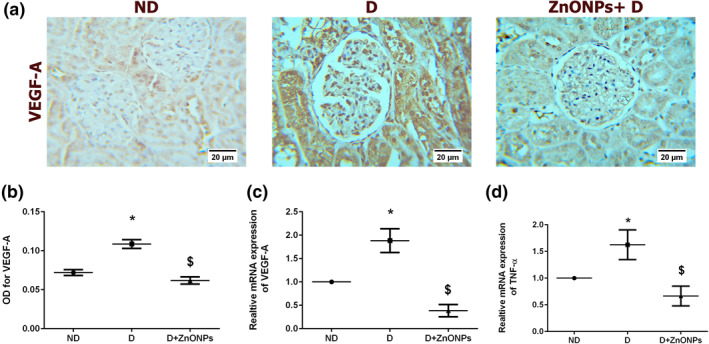
FIGURE 7.

(a) Representative VEGF‐A immunohistochemical stain of the kidney sections (haematoxylin staining; magnification ×400). (b) Quantification of the immunohistochemistry results expressed as integral optical density of brown staining in the different groups. (c) mRNA expression level of VEGF‐A. (d) mRNA TNF‐α expression level. Data represent the mean ± SEM. Symbol (*) denotes significant differences (P < 0.05) with non‐diabetic, symbol ($) denotes significant differences (P < 0.05) with diabetic group. Abbreviations: ND, non‐diabetic; D, diabetic; ZnONPs + D, zinc oxide nanoparticle–treated diabetic group; OD, optical density; TNF‐α, tumour necrosis factor‐α; VEGEF‐A, vascular endothelial growth factor‐A
