FIGURE 1.

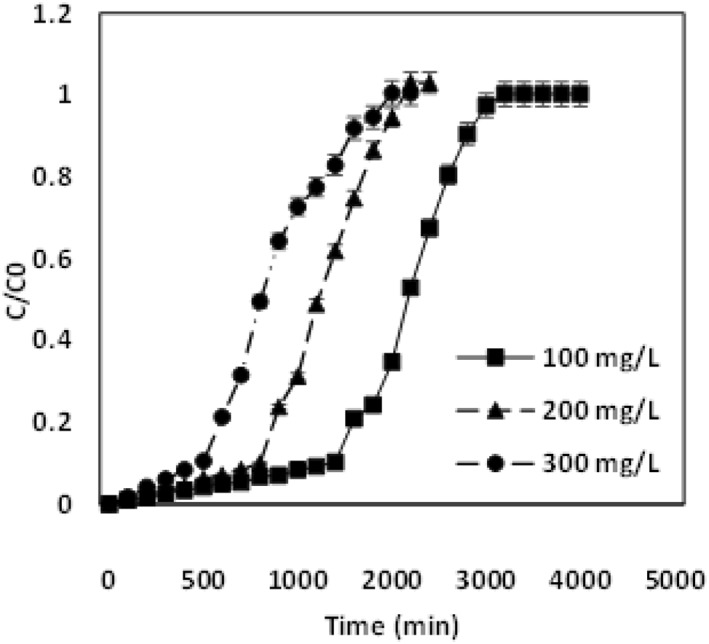
Breakthrough curve analysis for the adsorption of chromium at different concentration ranges of 100 mg/L, 200 mg/L and 300 mg/L

Breakthrough curve analysis for the adsorption of chromium at different concentration ranges of 100 mg/L, 200 mg/L and 300 mg/L