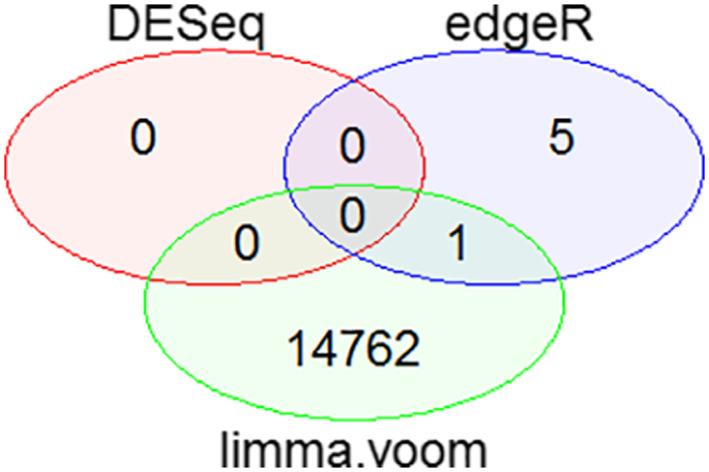
FIGURE 2.

Venn diagram for the Comparison of DESeq, edgeR and limma‐voom on the Basis of p‐value. It shows the total number of significant genes observed from each tool based on p‐value < 0.05. No significant differentially expressed genes (DEGs) were obtained from DESeq. EdgeR. It gave five significant DEGs based on p‐value and limma‐voom provided 14,762 significant differentially expressed genes on the basis of both p‐value and adjusted p‐value. There was 1 common DEG between edgeR and limma‐voom
