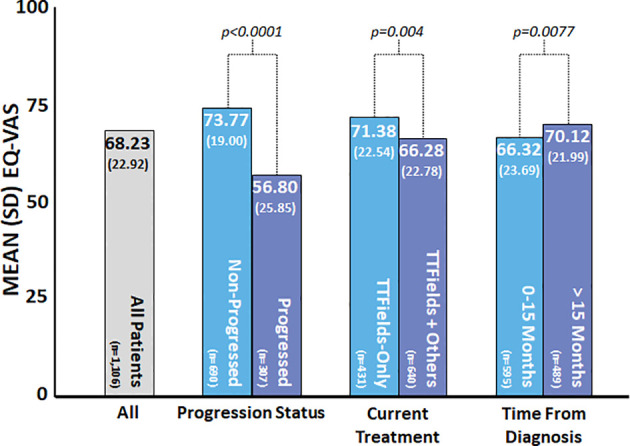
Figure 3.

Patient-reported EuroQol’s visual analogue scale (EQ-VAS) by subgroup. EQ-VAS was measured at the time of the survey, and patient and clinical characteristics were self-reported by patients at the time of the survey. Higher values indicated improved self-rated health, and lower values indicated worse self-rated health. P-values were calculated using the t-test.
